Extended EM for Planar Approximation of 3D Laser Range Data
500 likes | 681 Vues
Extended EM for Planar Approximation of 3D Laser Range Data. Rolf Lakaemper, Longin Jan Latecki, Temple University, USA. Topic: Approximate 3D point clouds using ‘planar patches’. Why ? Patches represent higher geometric information than raw point data…. Why ?. Why ?. Why ?

Extended EM for Planar Approximation of 3D Laser Range Data
E N D
Presentation Transcript
Extended EM for Planar Approximation of 3D Laser Range Data Rolf Lakaemper, Longin Jan Latecki, Temple University, USA
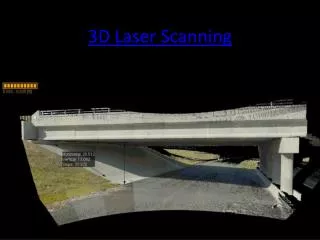
Topic: Approximate 3D point clouds using ‘planar patches’
Why ? Patches represent higher geometric information than raw point data…
Why ? …and are therefore a useful representation for • Robot Mapping • 3D Object recognition (landmarks) • CAD modelling • …
How ? The classical approach: Expectation Maximization (EM) Approximating the data (the points) with a model (the patches) in ‘an optimal way’ (maximizing the log-likelihood of the data given the model)
EM… …is used to iteratively • determine the correspondence between data points and patches. • Relocate the patches using linear regression weighted by the (a priori) probability of correspondences of points to patches
Problem • Number of model components must be known ( fixed in the classical approach, the reason being the log-likelihood, leading to over fitting if arbitrary model components are allowed) • Initial position of model components must be close to final solution (since EM converges to a local minimum only)
Problem Example : Approximation with a single patch:
Solution Dynamic adjustment of number of patchesextendingEM by Split & Merge
Split & Merge Split:insufficiently fitting patches are split
Split & Merge Merge:sufficiently similar patches are merged
Extended EM The extended algorithm dynamically adjusts the number of model components and solves the problems of classical EM EM SPLIT EM MERGE
Some Details A patch is a rectangular element subdivided into a grid of tiles. A tile is supported if a sufficient number of data points is close enough
Some Details supported tiles support points patch
How to Split • Determine Split-lines • Split, if result would not be merged
How to Split • Determine Split-lines
Split SPLIT is followed by EM step (Note: split always leads to a better fit by log-likelihood criterion, but not necessarily to a ‘visually better’ result, e.g. over fitting) EM SPLIT EM MERGE
How to Merge • Determine similarity of pairs of patches (candidates) • Exit if no candidates are present • Compute merged patch of best candidate by linear regression • Goto 1
Determine candidates …the underlying similarity measure takes into account the closeness, coplanarity and angle between normals of two patches…
Determine candidates …the underlying similarity measure takes into account the closeness, coplanarity and angle between normals of two patches… • Overlapping bounding boxes • Sharing support points
Determine candidates …the underlying similarity measure takes into account thecloseness,coplanarity and angle between normals of two patches… D1
Determine candidates …the underlying similarity measure takes into account thecloseness,coplanarity and angle between normals of two patches… D2
Determine candidates …the underlying similarity measure takes into account thecloseness,coplanarity and angle between normals of two patches… Candidate: min(D1,D2) < Threshold
Determine Merged Patch Simple (unweighted)regression with union of point-sets (this equals a single EM step with a single model component, i.e. the new patch)
Merge Merge is followed by EM step Merge controls the max. number of patches, it extends the log likelihood quality criterion to avoid overfitting EM SPLIT EM MERGE
Results: Wall Test (robustness to noise) (Init, Ground Truth Model)
Results: Wall Test (Init, Random number and location of patches)
Results: Wall Test (Init, Random number and location of patches)
Results: Berkeley Campus (Init, random number & location of patches)
Results: Berkeley Campus (Iteration 1)
Results: Berkeley Campus (Iteration 3)
Results: Berkeley Campus (final)
Results: Berkeley Campus (final, supporting point sets)
Results: Berkeley Campus Segmentation into planar elements allows for 2D shape (landmark) recognition
Results: Berkeley Campus Segmentation into planar elements allows for 2D shape (landmark) recognition
Alternative Applications Creating CAD Models
Conclusion • Approximation of 3D point sets by patches to gain higher representation • Classical EM was extended by Split and Merge • Number of Model Components is dynamically adjusted • Merge avoids overfit • Works pretty well !