Comparative Genomics
Comparative Genomics. Virulence in E. coli Diversity of Genomes How Many Genomes are There? Different Genome Perspectives. Virulence in E. coli. 1997- Fred Blattner lab at UWis sequenced E. coli K12 strain 2001- sequenced pathogenic strain O157:H7

Comparative Genomics
E N D
Presentation Transcript
Comparative Genomics Virulence in E. coli Diversity of Genomes How Many Genomes are There? Different Genome Perspectives
Virulence in E. coli • 1997- Fred Blattner lab at UWis sequenced E. coli K12 strain • 2001- sequenced pathogenic strain O157:H7 • This strain causes hemorrhagic colitis which affects 75,000 people each year • Genome has 5.5 Mb instead of 4.6 Mb • Has 1.3 Mb of “O-islands” not found in K12, K12 has .5 Mb of “K-islands” not found in O157:H7 (1387 and 528 genes, respectively)
Island Genes • Many of the O157:H7 unique genes are predicted to be virulence genes, including toxins, metabolic pathways, transporters, and adhesion molecules. • K-12, however, also have genes in these categories but the strain is not virulent. • A striking difference between O-islands and K-islands is their base compositions, which differ from that of the backbone. • Many of the island genes have orthologs in other species and viruses and may have resulted from horizontal transfer.
Chi-square Analysis How to tell if base compositions, such as those associated with O- and K- islands really are different from the norm.
Hypothesis: the base composition is equal c2 = 35.32
Differences Between Two Strains • Virulence may be due to genes on the “O-islands” or to differences between shared genes • Although they share 75% of their DNA, only 25% of their genes are identical • The rest have at least 1 base difference While this amount of difference is small, it can mean the difference between healthy individuals and those with sickle-cell anemia or cystic fibrosis
460 Genomes, and counting… • The more genomes we sequence, the wide diversity of these genomes becomes more evident. • These genomes range in size from .5-10 Mb and in GC content from 25-75%. These seem to correlate, since GTP and CTP take more energy to make. • One trend is that stable niches tend to accommodate small genomes while volatile environments do not. • One thing that remains fairly constant is coding capacity, prokaryotes all have about 1 gene/kb.
Circular Prokaryotic Chromosomes • Another thing we have learned are that not all prokaryotic chromosomes are circular. • 3 distantly related groups of bacteria have linear chromosomes that seem to have evolved independently. • In regards to chromosome #, some confusion exists whether particular pieces of DNA are chromosomes or plasmids. • Two criteria are used to define a chromosome: • Does it contain essential genes? • Does it contain ribosomal genes?
Genomes are Constantly Changing • The size of a genome may change rapidly due to horizontal transfer or fusing of genomes. • The cost of replicating additional DNA must be balanced with the benefit of having genes that may lend a selective advantage. • If the cell evolves to fill a new niche, losing unused genes may be advantageous. • Most bacteria in similar niches have similar sized genomes. Gut bacteria, for instance, have genomes in the 4-5 Mb range.
Experimental Procedures • 1,500 liters of surface water was collected 7 times from 4 different sites around the sea. • This was passed through filters which trapped particles between .1 and 3 mm. • Collected cells were lysed and their DNA cut into <1 kb pieces which were then cloned. • Genomic DNA was extracted from the filters and subjected to shotgun sequencing.
Results: • About 1 million separate sequences were obtained, totaling 1.6 billion base pairs of DNA • At least 1,412 different rRNA genes are represented in this sample, including 148 which are new to the database. • Using 6 other genes for comparison, a range of 341-569 phylotypes (ie. species) were sampled (including 12 complete genomes). • As the cost of sequencing DNA continues to drop, this approach may become the “next wave” of research into biodiversity
Sampling Problems • One problem with this method is that favors more abundant species. The coverage for a particular gene in an abundant species is better and a greater number of genes/species exist. • 53% of all DNA from sample #1 were from two genera: Shewanella & Burkholderia. This is a mystery since the former prefers nutrient-rich water and the latter is usually terrestrial. • Calculations to correct for lost species estimate that 1,800 different species may have been present.
New Genes Discovered • A total of 1.2 million genes were characterized in this study, including 70,000 novel ones. • Bacteriorhodopsin was one popular gene family, previous sampling using PCR had uncovered 67 homologs, but this study found 782 new ones. • 13 families of bacteriorhodopsin were characterized, from a wider range of bacteria than previously thought. • One must keep in mind that this data was collected using 1.5 x 10³l of water, while the ocean’s estimated volume is 1.37 x 10¹⁵l.
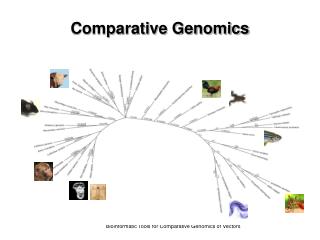
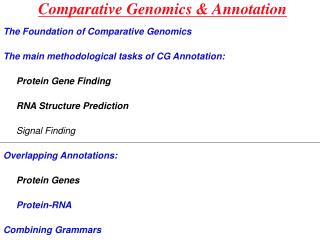
Different Genome Perspectives • What you see using comparative genomics depends on what perspective you take. • Zooming out, from small to large, we get: • amino acids • genes • gene families • segments of chromosomes • whole chromosomes
Out with the Old, In with the New • One group decided to look at proteomes at the amino acid level. Instead of worrying about the proteins encoded, the researchers identified amino acids that were identical in 2 distantly related species but different in 2 closely related species. This focuses on evolutionary drift. • One pattern was seen: amino acids predicted to be among the 1st incorporated into the genetic code are decreasing, while those predicted to be newer are increasing in frequency. This is true across all 3 domains of life.
Gene Family Level • A German group led by Svante Pääbo studied the evolution of olfactory receptor (OR) genes in 19 primates + mouse. • They plotted the number of OR pseudogenes in each species studied. • New World monkeys clustered around 18% pseudogenes, while Old World monkeys had around 30%. Humans had >50% pseudogenes. • The one exception is the howler monkey, which seems out of place. Interestingly, all Old World monkeys see in 2 colors, with the exception of the howler monkey, which sees in 3 colors like New World monkeys.
Whole Chromosome Level • Evan Eichler at Case Western Reserve examined human chromosome 7, looking for recombination hot spots. There were a total of 27, 12 on the short arm (p) and 15 on the long arm (q). • A team of researchers mapped the recombination events that have produced syntenic regions in human, mouse, rat, and dog. • CTVM is a genetic disease in dogs that leads to thickened heart valves, it has been mapped to canine chromosome 9. This region is syntenic with chromosome 17 in humans.
Comparing 4 Chromosomes • When all 4 chromosomes (dog, human, mouse & rat) are compared simultaneously, colored lines are used to highlight the recombinational hotspots, with shaded regions showing the 2 large human recombined areas. • Crossing lines show inversions, while bent lines that do not cross show translocations. • The site of recombination, as well as gene loss, is often conserved across species. Highly repetitive DNA is often involved in recombination
Most Recent Common Ancestor Chromosomes can be Constructed using recombination data.