Download
1 / 46
470 likes | 828 Vues
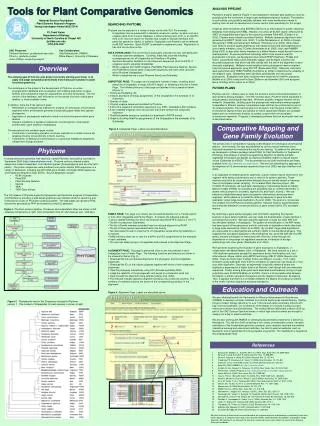
Comparative Genomics I: Tools for comparative genomics. Penn State Univ. : Ross Hardison, Webb Miller, Francesca Chiaromonte, Laura Elnitski, James Taylor, David King, Hao Wang, Ying Zhang, Scott Schwartz, Shan Yang, Jia Li, Diana Kolbe Univ. California at Santa Cruz : David Haussler, Jim Kent

E N D
Comparative Genomics I: Tools for comparative genomics Penn State Univ.: Ross Hardison, Webb Miller, Francesca Chiaromonte, Laura Elnitski, James Taylor, David King, Hao Wang, Ying Zhang, Scott Schwartz, Shan Yang, Jia Li, Diana Kolbe Univ. California at Santa Cruz: David Haussler, Jim Kent Lawrence Livermore National Lab: Ivan Ovcharenko, Lisa Stubbs Institute for Systems Biology: Arian Smit Thanks to the Mouse, Rat, Chicken and other Genome Sequencing Consortium
DNA sequences of mammalian genomes • Human: 2.9 billion bp, “finished” • High quality, comprehensive sequence, very few gaps • Mouse, rat, dog, oppossum, chicken, frog etc. etc etc. • About 40% of the human genome aligns with mouse • This is conserved, but not all is under selection. • About 5-6% of the human genome is under purifying selection since the rodent-primate divergence • About 1.2%codes for protein • The 4 to 5% of the human genome that is under selection but does not code for protein should have: • Regulatory sequences • Non-protein coding genes (UTRs and noncoding RNAs) • Other important sequences
Leveraging genome evolution to discover function • Overall goals and core concepts • All-vs-all whole-genome comparisons • Comparison of no two species is ideal for finding all functional sequences • Alignment scores: • Aid in finding functional elements • Discriminate between functional classes • Example of experimental tests of the bioinformatic predictions
Negative selection (purifying) Positive selection (adaptive) Exonic segments coding for regions of a polypeptide with common function in two species. Exonic segments coding for regions of a polypeptide in which change is beneficial to one of the two species. Ideal case for interpretation Similarity Neutral DNA Position along chromosome
Complications to interpreting divergence • Sequence alignments are good but not perfect • Models for neutral DNA are not perfect • Classic: coding nucleotide positions that do not cause an amino alteration when changed • KS = synonymous substitution rate • Ancestral repeats • Now-defunct transposons that were active in the last common ancestor to species being compared • Intronic and intergenic DNA • Rate of divergence of neutral DNA is NOT constant • Varies +/- 20% in human-mouse comparisons for 1Mb windows across the genome • Need to incorporate rate variation into models for likelihood of selection • E.g. KA /KS ratio (nonsynonymous to synonymous substitution rate)
Pairwise alignments: PipMaker and zPicture http://www.bx.psu.edu/ http://www.dcode.org/
PipMaker Server for aligning genomic DNA sequences • BlastZ • Align long sequences (> 1 megabase, Mb) • Handles multiple copies of related genes, other sequence rearrangements • Compute all local alignments between 2 sequences of 1Mb each in about 1 min • Zheng Zhang, Webb Miller et al. • PipMaker • Show results in a compact display with flexible features • Scott Schwartz, Webb Miller, et al. (2000) Genome Res. 10:577-586.
Using PipMaker • Files needed: • Sequence 1 = reference sequence (e.g. human), FASTA format • Sequence 2 = other sequence (e.g. mouse), FASTA format • RepeatMasker output for sequence 1 • Exons file for sequence 1 (lists position, orientation and names of genes and individual exons) • Optional: “underlay file” to color pip by functional category • All must be text-only • URL is http://bio.cse.psu.edu, go to PipMaker • Enter files by browsing or cut-and-paste • Submit files, receive output by e-mail. • Should align 1 Mb x 1 Mb in less than a minute.
Example of using PipMaker: BTK human vs. mouse • Defects in BTK lead to X-linked agammaglobulinemia; BTK may be needed for maturation of B cells • Sequences from R. Gibb’s lab, each about 100 kb: • human: GenBank U78027 • mouse: GenBank U58105 • Exons, underlay files from PipMaker examples • Repeats from RepeatMasker
Pecent identity plot (pip) from PipMaker: BTK Exons are almost always conserved with no/few gaps. Highly conserved non-coding sequences in introns 4 and 5. The conserved sequences 5’ and 3’ to the 1st exon contribute to lineage- specific expression of BTK (Oeltjen et al. 1997).
Automated extraction of sequences and annotations for PipMaker and zPicture • Making “exon file” (gene and other functional annotation) and masking repeats • Essential to interpreting the alignments • It is a pain • Better idea (Ovcharenko): Automate extraction of sequences, annotations, masking • PipMaker: PipHelper • zPicture: Integrated into the interface
Global aligners • Can get global alignments from Vista • Advantageous when the sequences being compared are not extensively rearranged and align over most of their lengths • E.g. comparing two alleles • Comparing closely related species
MultiPip : Exons and potential regulatory sequences are revealed progressively
Aligners for multiple sequences • Local alignments in multiple species • MultiPipMaker • Mulan (dcode.org) • Use pairwise blastZ alignments, joined into a multiple alignment by multiZ. • Sequence 1 is the reference. • Lose sequences in comparison species that do not align with the reference in pairwise alignments. • Mulan also runs TBA (threaded blockset aligner). • Retains all sequences, even those that do not align with the reference. • Can change reference sequence to get “human-centric” or mouse-centric views of multiple alignment • Global multiple alignments: MLAGAN, MAVID
Leveraging genome evolution to discover function • Overall goals and core concepts • All-vs-all whole-genome comparisons • Comparison of no two species is ideal for finding all functional sequences • Alignment scores: • Aid in finding functional elements • Discriminate between functional classes • Example of experimental tests of the bioinformatic predictions
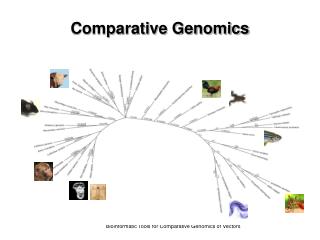
Whole genome alignments of mammals, birds, flies, worms and yeast
Alignment of genomes • blastZ for pairwise alignments • multiZ for multiple alignment • Human, chimp, mouse, rat, chicken, dog • Also multiple fly, worm, yeast genomes • Organize local alignments: chains and nets • All against all comparisons • High sensitivity and specificity • Computer cluster at UC Santa Cruz • 1024 cpus Pentium III • Job takes about half a day • Results available at • UCSC Genome Browser http://genome.ucsc.edu • Galaxy server: http://www.bx.psu.edu Scott Schwartz Webb Miller Jim Kent Schwartz et al., 2003, blastZ, Genome Research Blanchette et al., 2004, TBA and multiZ, Genome Research David Haussler
blastZ: Each segment of human is given the opportunity to align with all mouse sequences. Level 1 chain Level 2 chain Net Genome-wide local alignment chains Human: 2.9 Gb assembly. Mask interspersed repeats, break into 300 segments of 10 Mb. Human Mouse Run blastZ in parallel for all human segments. Collect all local alignments above threshold. Organize local alignments into a set of chains based on position in assembly and orientation.
Find common sequences blastZ, multiZ Human Identify functional sequences: ~ 145 Mbp All mammals 1000 Mbp Mouse Rat Also birds: 72Mb Comparative genomics to find functional sequences Genome size 2,900 2,400 2,500 1,200 million base pairs (Mbp) Papers in Nature from mouse and rat and chicken genome consortia, 2002, 2004
0.13 Mouse AHMR 0.083 Rodent AMR 0.28 Rat 0.091 Stdev 0.011 - 0.013 Variation in rates by lineage • Substitutions per site in likely neutral DNA • Ancestral repeats • About 3-fold higher in combined branches to rodents than in human • Fast rate in rodent, mouse and rat branches • Rate for rat branch is slightly faster than for mouse • Similar differences are seen for microinsertions and microdeletions Human Rat Genome Sequencing Project Consortium, 2004, Nature
Co-variation in substitution, deletion, insertion, and recombination on Chr 22
Implications of co-variation in divergence • Large regions (megabase sized) are changing relatively fast or slow for (almost) all types of divergence • Neutral substitution, insertion, deletion, recombination • This is a consistent property of each region of genomic DNA • Similar patterns in mouse and human for lineage-specific interspersed repeats • Similarly fast or slow rates for orthologous regions in human-chimp and mouse-rat comparisons • An aligned segment with a given similarity score in a fast-changing region is MORE significant than an aligned segments with the same similarity score in a slow-changing region. • Must take the differential rate into account in searching for functional DNA = DNA under selection.
p-values reflecting different divergence rates reveal more significant alignments Jia Li and Webb Miller: HMMs to model local rate variation, then use Markov model to assign p-value given that local rate.
Use measures of alignment quality to discriminate functional from nonfunctional DNA • Compute a conservation score adjusted for the local neutral rate • Score S for a 50 bp region R is the normalized fraction of aligned bases that are identical • Subtract mean for aligned ancestral repeats in the surrounding region • Divide by standard deviation p = fraction of aligned sites in R that are identical between human and mouse m = average fraction of aligned sites that are identical in aligned ancestral repeats in the surrounding region n = number of aligned sites in R Waterston et al., Nature
Decomposition of conservation score into neutral and likely-selected portions Neutral DNA (ARs) All DNA Likely selected DNA At least 5-6% S is the conservation score adjusted for variation in the local substitution rate. The frequency of the S score for all 50bp windows in the human genome is shown. From the distribution of S scores in ancestral repeats (mostly neutral DNA), can compute a probability that a given alignment could result from locally adjusted neutral rate. Waterston et al., Nature
5% Coverage of human by alignments with other vertebrates ranges from 1% to 91% Human 5.4 Millions of years 91 92 173 220 310 360 450
Distinctive divergence rates for different types of functional DNA sequences
Leveraging genome evolution to discover function • Overall goals and core concepts • All-vs-all whole-genome comparisons • Comparison of no two species is ideal for finding all functional sequences • Alignment scores: • Aid in finding functional elements • Discriminate between functional classes • Example of experimental tests of the bioinformatic predictions
Score multi-species alignments for features associated with function • Multiple alignment scores • Binomial, parsimony (Margulies et al., 2003, Genome Research) • PhastCons • Siepel et al. 2005, Genome Research • Phylogenetic Hidden Markov Model • Posterior probability that a site is among the 10% most highly conserved sites • Allows for variation in rates and autocorrelation in rates • Factor binding sites conserved in human, mouse and rat • Tffind (from M. Weirauch, Schwartz et al., 2003) • Score alignments by frequency of matches to patterns distinctive for CRMs • Regulatory potential (Elnitski et al., 2003; Kolbe et al., 2004)
Score alignments for level of conservation • phastCons (Siepel and Haussler, 2003) • Phylogenetic Hidden Markov Model • Posterior probability that a site is among the 10% most highly conserved sites • Allows for variation in rates and autocorrelation in rates Alignment seq1 G T A C C T A C T A C G C A seq2 G T G T C G - - A G C C C A seq3 G T G A C T - - A C C G C G
Striking conserved noncoding sequences. phastCons on Conservation track at Genome Browser
Deletion of locus control region associated with beta-thalassemia
Galaxy metaserver for integrative analysis of genomic data • Use servers at primary data repositories (e.g. UCSC Table Browser) to gather initial data • Results stored and analyzed at Galaxy • Operations • Union, intersection, subtraction • Clustering, proximity • Bioinformatic tools: • Retrieve alignments • KA/KS, PHYLIP programs for molecular evolution • EMBOSS tools for sequence analysis • http://www.bx.psu.edu
Conclusions • Particular types of functional DNA sequences are conserved over distinctive evolutionary distances. • Multispecies alignments can be used to predict whether a sequence is functional (signature of purifying selection). • Alignments can be used to predict certain functional regions, including some cis-regulatory elements. • The predictions of cis-regulatory elements for erythroid genes are validated at a good rate. • Databases such as the UCSC Table Browser and Galaxy provide access to these data. • http://genome.ucsc.edu/ • http://www.bx.psu.edu/ • Expect improvements at all steps.
Many thanks … PSU Database crew: Belinda Giardine, Cathy Riemer, Yi Zhang, Anton Nekrutenko Wet Lab: Yuepin Zhou, Hao Wang, Ying Zhang, Yong Cheng, David King RP scores and other bioinformatic input: Francesca Chiaromonte, James Taylor, Shan Yang, Diana Kolbe, Laura Elnitski Alignments, chains, nets, browsers, ideas, … Webb Miller, Jim Kent, David Haussler Funding from NIDDK, NHGRI, Huck Institutes of Life Sciences at PSU