Comparative Genomics
Comparative Genomics. Ross Hardison, Penn State University Major collaborators: Webb Miller, Francesca Chiaromonte, Laura Elnitski, David King, et al., PSU James Taylor: Courant Institute, New York University David Haussler, Jim Kent, Univ. California at Santa Cruz

Comparative Genomics
E N D
Presentation Transcript
Comparative Genomics Ross Hardison, Penn State University Major collaborators: Webb Miller, Francesca Chiaromonte, Laura Elnitski, David King, et al., PSU James Taylor: Courant Institute, New York University David Haussler, Jim Kent, Univ. California at Santa Cruz Ivan Ovcharenko, Lawrence Livermore National Lab PSU Nov. 28, 2006
Major goals of comparative genomics • Identify all DNA sequences in a genome that are functional • Selection to preserve function • Adaptive selection • Determine the biological role of each functional sequence • Elucidate the evolutionary history of each type of sequence • Provide bioinformatic tools so that anyone can easily incorporate insights from comparative genomics into their research
Three major classes of evolution • Neutral evolution • Acts on DNA with no function • Genetic drift allows some random mutations to become fixed in a population • Purifying (negative) selection • Acts on DNA with a conserved function • Signature: Rate of change is significantly slower than that of neutral DNA • Sequences with a common function in the species examined are under purifying (negative) selection • Darwinian (positive) selection • Acts on DNA in which changes benefit an organism • Signature: Rate of change is significantly faster than that of neutral DNA
Negative selection (purifying) Positive selection (adaptive) Exonic segments coding for regions of a polypeptide with common function in two species. Exonic segments coding for regions of a polypeptide in which change is beneficial to one of the two species. Ideal case for interpretation Similarity Neutral DNA Position along chromosome
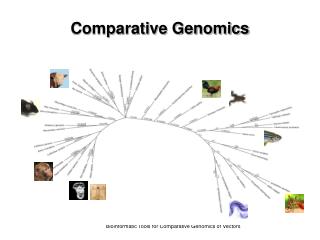
Taxonomic distribution of homologs of mouse proteins Waterston et al.
Conservation in different parts of genes Average percent identity (black) or percent aligned (blue) for 10,000 orthologous genes Waterston et al, Mouse Genome, Nature
Levels of conservation (Human vs Mouse) in different types of proteins Black: Nuclear proteins Red: Cytoplasmic proteins Gray: Extracellular proteins; positive, diversifying selection Black: all orthologous proteins (Hum-mouse) 12,845 1:1 gene pairs Red: proteins with recognized domains Gray: proteins without recognized domains KA= rate of nonsynonymous substitutions KS= rate of synonymous substitutions Waterston et al. Nature 2002
Rat-specific gene expansions • Genes that have expanded in number in rats are enriched in • Immune function/ antigen recognition • immunoglobulins, T-cell receptor alpha • Detoxification • cytochrome P450 • Reproduction • alpha2u-globulin • Olfaction and odorant detection • Olfactory receptors • Also are rapidly evolving • Segmental duplications are enriched for the same genes Rat Genome SPC 2004 Nature
Adaptive remodeling of gene clusters Figure 13 Adaptive remodeling of genomes and genes. a, Orthologous regions of rat, human and mouse genomes encoding pheromone-carrier proteins of the lipocalin family (a2u-globulins in rat and major urinary proteins in mouse) shown in brown. Zfp37-like zinc finger genes are shown in blue. Filled arrows represent likely genes, whereas striped arrows represent likely pseudogenes. Gene expansions are bracketed. Arrowhead orientation represents transcriptional direction. Flanking genes 1 and 2 are TSCOT and CTR1, respectively. Rat Genome SPC 2004 Nature
DCODE.org Comparative Genomics: Align your own sequences blastZ multiZ and TBA
Pre-computed alignment of genomes • blastZ for pairwise alignments • multiZ for multiple alignment • Human, chimp, mouse, rat, chicken, dog • Also multiple fly, worm, yeast genomes • Organize local alignments: chains and nets • All against all comparisons • High sensitivity and specificity • Computer cluster at UC Santa Cruz • 1024 cpus Pentium III • Job takes about half a day • Results available at • UCSC Genome Browser http://genome.ucsc.edu • Galaxy server: http://www.bx.psu.edu Webb Miller Jim Kent Schwartz et al., 2003, blastZ, Genome Research Blanchette et al., 2004, TBA and multiZ, Genome Research David Haussler
blastZ: Each segment of human is given the opportunity to align with all mouse sequences. Level 1 chain Level 2 chain Net Genome-wide local alignment chains Human: 2.9 Gb assembly. Mask interspersed repeats, break into 300 segments of 10 Mb. Human Mouse Run blastZ in parallel for all human segments. Collect all local alignments above threshold. Organize local alignments into a set of chains based on position in assembly and orientation.
Find common sequences blastZ, multiZ Human Identify functional sequences: ~ 145 Mbp All mammals 1000 Mbp Mouse Rat Also birds: 72Mb Comparative genomics to find functional sequences Genome size 2,900 2,400 2,500 1,200 million base pairs (Mbp) Papers in Nature from mouse and rat and chicken genome consortia, 2002, 2004
Use measures of alignment quality to discriminate functional from nonfunctional DNA • Compute a conservation score adjusted for the local neutral rate • Score S for a 50 bp region R is the normalized fraction of aligned bases that are identical • Subtract mean for aligned ancestral repeats in the surrounding region • Divide by standard deviation p = fraction of aligned sites in R that are identical between human and mouse m = average fraction of aligned sites that are identical in aligned ancestral repeats in the surrounding region n = number of aligned sites in R Waterston et al., Nature
Decomposition of conservation score into neutral and likely-selected portions Neutral DNA (ARs) All DNA Likely selected DNA At least 5-6% S is the conservation score adjusted for variation in the local substitution rate. The frequency of the S score for all 50bp windows in the human genome is shown. From the distribution of S scores in ancestral repeats (mostly neutral DNA), can compute a probability that a given alignment could result from locally adjusted neutral rate. Waterston et al., Nature
DNA sequences of mammalian genomes • Human: 2.9 billion bp, “finished” • High quality, comprehensive sequence, very few gaps • Mouse, rat, dog, oppossum, chicken, frog etc. etc etc. • About 40% of the human genome aligns with mouse • This is conserved, but not all is under selection. • About 5-6% of the human genome is under purifying selection since the rodent-primate divergence • About 1.2%codes for protein • The 4 to 5% of the human genome that is under selection but does not code for protein should have: • Regulatory sequences • Non-protein coding genes (UTRs and noncoding RNAs) • Other important sequences
Conservation score S in different types of regions Red: Ancestral repeats (mostly neutral) Blue: First class in label Green: Second class in label Waterston et al., Nature
Leverage many species to improve accuracy and resolution of signals for constraint ENCODE multi-species alignment group Margulies et al., 2007
5% Coverage of human by alignments with other vertebrates ranges from 1% to 91% Human 5.4 Millions of years 91 92 173 220 310 360 450
Distinctive divergence rates for different types of functional DNA sequences
Large divergence in cis-regulatory modules from opossum to platypus
cis-Regulatory modules conserved from human to fish • About 20% of CRMs • Tend to regulate genes whose products control transcription and development Millions of years 91 173 310 450
cis-Regulatory modules conserved in eutherian mammals and marsupials • Human-marsupial alignments capture about 60% of CRMs • Tend to occur close to genes involved in aminoglycan synthesis, organelle biosynthesis • Human-mouse alignments capture about 87% of CRMs • Tend to occur close to genes involved in apoptosis, steroid hormone receptors, etc. • Within aligned noncoding DNA of eutherians, need to distinguish constrained DNA (purifying selection) from neutral DNA. Millions of years 91 173 310 450
Score multi-species alignments for features associated with function • Multiple alignment scores • Margulies et al. (2003) Genome Research 13: 2505-2518 • Binomial, parsimony • PhastCons • Siepel et al. (2005) Genome Research 15:1034-1050 • Phylogenetic Hidden Markov Model • Posterior probability that a site is among the most highly conserved sites • GERP • Cooper et al. (2005) Genome Research 15:901-913 • Genomic Evolutionary Rate Profiling • Measures constraint as rejected substitutions = nucleotide substitution deficits
phastCons: Likelihood of being constrained • Phylogenetic Hidden Markov Model • Posterior probability that a site is among the most highly conserved sites • Allows for variation in rates along lineages c is “conserved” (constrained) n is “nonconserved” (aligns but is not clearly subject to purifying selection) Siepel et al. (2005) Genome Research 15:1034-1050
Larger genomes have more of the constrained DNA in noncoding regions Siepel et al. 2005, Genome Research
Some constrained introns are editing complementary regions:GRIA2 Siepel et al. 2005, Genome Research
3’UTRs can be highly constrained over large distances 3’ UTRs contain RNA processing signals, miRNA targets, other regions subject to constraints Siepel et al. 2005, Genome Research
Ultraconserved elements = UCEs • At least 200 bp with no interspecies differences • Bejerano et al. (2004) Science 304:1321-1325 • 481 UCEs with no changes among human, mouse and rat • Also conserved between out to dog and chicken • More highly conserved than vast majority of coding regions • Most do not code for protein • Only 111 out of 481overlap with protein-coding exons • Some are developmental enhancers. • Nonexonic UCEs tend to cluster in introns or in vicinity of genes encoding transcription factors regulating development • 88 are more than 100 kb away from an annotated gene; may be distal enhancers
GO category analysis of UCE-associated genes • Genes in which a coding exon overlaps a UCE • 91 Type I genes • RNA binding and modification • Transcriptional regulation • Genes in the vicinity of a UCE (no overlap of coding exons) • 211 Type II genes • Transcriptional regulation • Developmental regulators Bejerano et al. (2004) Science
Pennacchio et al., http://enhancer.lbl.gov/ Intronic UCE in SOX6 enhances expression in melanocytes in transgenic mice UCEs Tested UCEs
The most stringently conserved sequences in eukaryotes are mysteries • Yeast MATa2 locus • Most conserved region in 4 species of yeast • 100% identity over 357 bp • Role is not clear • Vertebrate UCEs • More constrained than exons in vertebrates • Noncoding UCEs are not detectable outside chordates, whereas coding regions are • Were they fast-evolving prior to vertebrate/invertebrate divergence? • Are they chordate innovations? Where did they come from? • Role of many is not clear; need for 100% identity over 200 bp is not obvious for any • What molecular process requires strict invariance for at least 200 nucleotides? • One possibility: Multiple, overlapping functions
Use measures of alignment texture to discriminate functional classes of DNA • Mouse Cons track (L-scores) are measures of alignment quality. • Match > Mismatch > Gap • Alternatively, can analyze the patterns within alignments (texture) to try to distinguish among functional classes • Regulatory regions vs bulk DNA • Patterns are short strings of matches, mismatches, gaps • Find frequencies for each string using training sets • 93 known regulatory regions • 200 ancestral repeats (neutral) • Regulatory potential genome-wide • Elnitski et al. (2003) Genome Research 13: 64-72.
5/10 1/6 = 3 1/4 3/6 1/4 2/8 = 1 = 0.5 Evaluate patterns in alignments to discriminate functional classes of DNA 1. Collapse the alignment to a small alphabet, e.g. Match involving G or C = S Transition = I Gap = G Match involving A or T = W Transversion = V Alignment seq1 G T A C C T A C T A C G C A seq2 G T G T C G - - A G C C C A Collapsed alphabet S W I I S V G G V I S V S W 2. Is a pattern, e.g., SWIIS followed by V found more frequently inalignments of known cis-regulatory modules (set of 93) or neutral DNA (200 ancestral repeats)? 3. The regulatory potential for any alignment is a log-likelihood estimate of the extent to which its patterns are more like those in regulatory regions than in neutral DNA.
Good performance of regulatory potential (RP) for finding cis-regulatory modules Taylor et al. (2006) Genome Research, in press (October or November)
Genes Co-expressed in Late Erythroid Maturation • G1E-ER cells: proerythroblast line lacking the transcription factor GATA-1. • Can rescue by expressing an estrogen-responsive form of GATA-1 • Rylski et al., Mol Cell Biol. 2003
Predicted cis-Regulatory Modules (preCRMs) Around Erythroid Genes
Conservation of predicted binding sites for transcription factors Binding site for GATA-1 See poster from Yuepin Zhou, Yong Cheng, Hao Wang et al.
preCRMs with conserved consensus GATA-1 BS tend to be active on transfected plasmids
preCRMs with conserved consensus GATA-1 BS tend to be active after integration into a chromosome
preCRMs with High RP and Conserved Consensus GATA-1 Tend To Be Validated
Conclusions • Multispecies alignments can be used to predict whether a sequence is functional (signature of purifying selection). • Patterns in alignments and conservation of some TFBSs can be used to predict some cis-regulatory elements. • The predictions of cis-regulatory elements for erythroid genes are validated at a good rate. • Databases and servers such as the UCSC Table Browser, Galaxy, and others provide access to these data. • http://genome.ucsc.edu/ • http://www.bx.psu.edu/
Many thanks … PSU Database crew: Belinda Giardine, Cathy Riemer, Yi Zhang, Anton Nekrutenko Wet Lab: Yuepin Zhou, Hao Wang, Ying Zhang, Yong Cheng, David King RP scores and other bioinformatic input: Francesca Chiaromonte, James Taylor, Shan Yang, Diana Kolbe, Laura Elnitski Alignments, chains, nets, browsers, ideas, … Webb Miller, Jim Kent, David Haussler Funding from NIDDK, NHGRI, Huck Institutes of Life Sciences at PSU
MAT, MGC, V, T, GAP MAT-MAT-MAT-MAT-MAT * * * * * MAT-MAT-MAT-MAT-MGC * * * * * . . MAT-T-T-MGC-V * * * * ln(10) . . Computation of 2-way RP score using 5-symbol, 5th order Markov model Alignment Hum G T A C C T A C T A C C C A Mus G T G T C G - - A G C C C A MGC MAT T T MGC V GAP GAP MAT T MGC MGC MGC MAT Negative Training set-200 ancestral repeats Positive Training set-93 known CRMs MAT, MGC, V, T, GAP MAT-MAT-MAT-MAT-MAT * * * * * MAT-MAT-MAT-MAT-MGC * * * * * . . MAT-T-T-MGC-V * * * * 0.001 . . MAT, MGC, V, T, GAP MAT-MAT-MAT-MAT-MAT* * * * * MAT-MAT-MAT-MAT-MGC* * * * * . . MAT-T-T -MGC-V * * * * 0.0001 . . A score matrix is formed by taking log-odds ratio To measure how much more likely an alignment is regulatory as compared with netural, the log-odds ratios for each symbol over the entire length of the alignments are summed and normalized for the length of the alignments Regulatory Potential (RP) features