Download
1 / 12
120 likes | 593 Vues
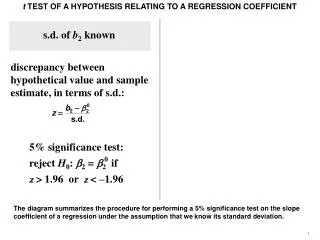
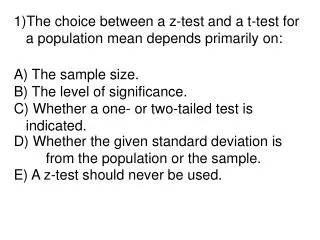
The choice between a z-test and a t-test for a population mean depends primarily on:. A) The sample size. B) The level of significance. C) Whether a one- or two-tailed test is indicated. E) A z-test should never be used.

E N D
The choice between a z-test and a t-test for a population mean depends primarily on: A) The sample size. B) The level of significance. C) Whether a one- or two-tailed test is indicated. E) A z-test should never be used. D) Whether the given standard deviation is from the population or the sample.
2) One of your peers claims that boys do better in math classes than girls. Together you run two independent simple random samples and calculate the given summary statistics of the boys and the girls for comparable math classes. In Calculus, 15 boys had a mean percentage of 82.3 with standard deviation of 5.6 while 12 girls had a mean percentage of 81.2 with standard deviation of 6.7. Which of the following would be the most appropriate test for establishing whether boys do better in math classes than girls? • Two sample z test for means • C) Two sample z test for proportions • D) Matched pair t test • E) One sample t test for means B) Two sample t test for means
3) Suppose a school district has always believed that the mean height of their eighth grade girls was 60 inches. Using the computer printout, which of the following represents the calculation for the appropriate test? Test of mu = 60.00 vs mu not = 60.00 Variable n mean stdev SE mean Heights 23 62.35 5.42 1.13 A) B) D) C) d) E)
The creators of a discovery-based learning system for statistics claim that students who are taught using their method experience greater success than students taught with a strictly lecture-based method. To test the claim , Professor Myers decided to teach on of his introductory courses using the discovery-based method and the other using a lecture-based course. Eighty introductory statistics students were randomly assigned to one of the Professor Myers’ two sections. The summary statistics for his end-of-course assessment appear below. 4)At a 0.01 significance level, test the claim that students who learn introductory statistics using a discovery-based approach show higher achievement that those taught using a lecture-based approach. A) Reject H0, p-value < 0.01 B) Fail to reject H0, p-value < 0.01 C) Reject H0, p-value > 0.01 D) Fail to reject H0, p-value > 0.01 E) There is not enough information to test the claim
The creators of a discovery-based learning system for statistics claim that students who are taught using their method experience greater success than students taught with a strictly lecture-based method. To test the claim , Professor Myers decided to teach on of his introductory courses using the discovery-based method and the other using a lecture-based course. Eighty introductory statistics students were randomly assigned to one of the Professor Myers’ two sections. The summary statistics for his end-of-course assessment appear below. 5) Construct a 95% confidence interval for the mean difference in scores of students taught using a lecture-based method versus a discovery-based method B) A) D) C) E)
6) It is believed that using a new fertilizer will result in a yield of 1.6 tons per acre. A botanist carries out a two-tailed test on a field of 64 acres. Determine the P-value if the mean yield per acre in the sample is 1.72 tons with a standard deviation of 0.4. What is the conclusion at a level of significance of 10%? 5%? 1%? • P = .0097, and so the 1.6-ton claim should be rejected at • all three of these levels. • C) P = .0097, and so the 1.6 ton claim should be rejected at • the 10% level but not at the 5% and 1% levels. • D) P = .0193, and so the 1.6 ton claim should be rejected at • the 1% level but not at the 10% and 5% levels. • E) P = .0097, and so there is not enough evidence to reject • the 1.6-ton claim at any of the three levels. B) P = .0193, and so the 1.6 ton claim should be rejected at the 10% and 5% levels but not at the 1% level.
7) An NCAA official claims that the average 5K time for students trying out for college cross-country teams is 17 minutes. A Big East coach believes the true figure is lower among Big East universities. He picks an SRS of 30 recruits and calculates their mean 5K time is 16 minutes and 52 seconds, with a standard deviation of 25 seconds. What is the p-value for the appropriate test? B) 0.08 C) 0.37 D) 0.42 E) 0.75 A) 0.04
A random sample of THS students was asked how many credits were needed to meet the FBISD recommended graduation requirements. The following results in the computer output were found: TEST MU = 24 VS MU NOT = 24 VARIABLE N MEAN STDEV CREDITS 34 22.25 1.87 8) Which of the following is the correct null and alternative hypotheses statements for this situation? A) H0: µ =24 vs. Ha: µ ≠24 B) H0: µ =24 vs. Ha: µ < 24 C) H0:p =24 vs. Ha: p ≠24 D) H0: µ =22.5 vs. Ha: µ ≠22.5 E) H0: p=22.5 vs. Ha: p ≠22.5
A random sample of THS students was asked how many credits were needed to meet the FBISD recommended graduation requirements. The following results in the computer output were found: TEST MU = 24 VS MU NOT = 24 VARIABLE N MEAN STDEV CREDITS 34 22.25 1.87 9) Which of the following is the correct method of calculating the test statistics for this situation? B) C) D) E) A)
A random sample of THS students was asked how many credits were needed to meet the FBISD recommended graduation requirements. The following results in the computer output were found: TEST MU = 24 VS MU NOT = 24 VARIABLE N MEAN STDEV CREDITS 34 22.25 1.87 10) The degrees of freedom for this situation is • 25 B) 30 • D) 34 E) 35 C) 33
A random sample of THS students was asked how many credits were needed to meet the FBISD recommended graduation requirements. The following results in the computer output were found: TEST MU = 24 VS MU NOT = 24 VARIABLE N MEAN STDEV CREDITS 34 22.25 1.87 11) The p-value for this situation is A) 0.00000004 C) 0.00000239 D) 0.99999760 E) none of these B) 0.00000479
Multiple Choice – Ch 23, 24, 25 – Inferences on Means • D 2) B • 3) D 4) A • 5) A 6) B • 7) A 8) A • 9) A 10) C • 11) B