Download
1 / 2
110 likes | 575 Vues
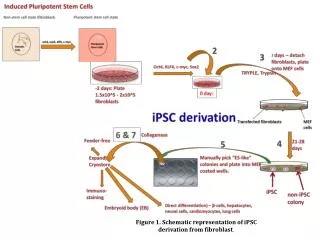
Figure 1. Schematic representation of iPSC derivation from fibroblast . A ) Terminally differentiated fibroblast cells. B) Undifferentiated induced pluripotent stem cell (IPSC) colony (positive to Oct-4, a marker for undifferentiated iPSCs .

E N D
Figure 1. Schematic representation of iPSC derivation from fibroblast.
A) Terminally differentiated fibroblast cells B) Undifferentiated induced pluripotent stem cell (IPSC) colony (positive to Oct-4, a marker for undifferentiated iPSCs. • C) Cardio-pulsing of differentiated embryoid body from iPSCsThis website is being updated. Video will be available by September 2014. Please visit us again then. Figure 2. Images of terminally differentiated fibroblast (A), undifferentiated IPSC colony (B), and video of cardiopulsingembryoid body (C).