Download
1 / 10
100 likes | 223 Vues
This study explores various constructs of the vaccinia virus (VV), focusing on the roles of the E3L gene and ADAR1 protein in viral behavior and host interactions. Constructs analyzed include wild-type VV, VVΔE3L expressing LacZ, and several mutants with alterations in E3L and ADAR1. Methods such as Western blotting, poly(I).poly(C) binding assays, and interferon sensitivity tests were conducted to investigate protein expression, viral replication, and interference with host cell functions. Results provide insights into viral mechanisms and potential therapeutic targets.

E N D
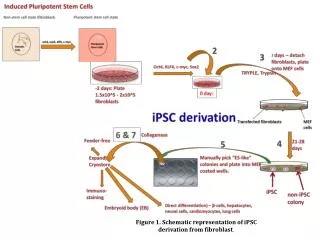
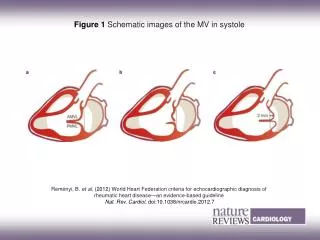
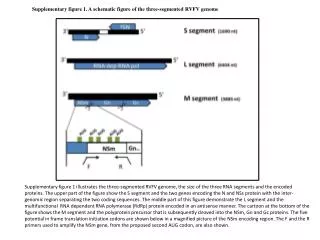
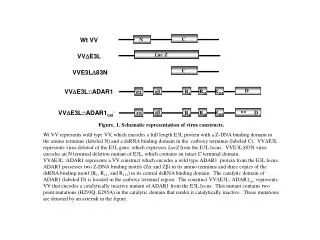
C Wt VV N Lac Z VVE3L C VVE3L83N D VVE3L::ADAR1 R111 R11 z R1 z * VVE3L::ADAR1cat- * z R111 D z R1 R11 Figure. 1. Schematic representation of virus constructs. Wt VV represents wild type VV, which encodes a full length E3L protein with a Z-DNA binding domain in the amino terminus (labeled N) and a dsRNA binding domain in the carboxy terminus (labeled C). VVE3L represents virus deleted of the E3L gene, which expresses LacZ from the E3L locus. VVE3L83N virus encodes an N terminal deletion mutant of E3L, which contains an intact C terminal domain. VVE3L::ADAR1 represents a VV construct which encodes a wild type ADAR1 protein from the E3L locus. ADAR1 possesses two Z-DNA binding motifs (Z and Z) in its amino terminus and three copies of the dsRNA binding motif (R1, R11, and R111) in its central dsRNA binding domain. The catalytic domain of ADAR1 (labeled D) is located in the carboxy terminal region. The construct VVE3L::ADAR1cat-represents VV that encodes a catalytically inactive mutant of ADAR1 from the E3L locus. This mutant contains two point mutations (H293Q, E295A) in the catalytic domain that render it catalytically inactive. These mutations are denoted by an asterisk in the figure.
Copenhagen WR VVE3L::ADAR1cat- VVE3L::ADAR1cat- VVE3L::ADAR1 VVE3L::ADAR1 VVE3L83N VVE3L83N Wt VV Wt VV Mock Figure. 2.Western blot using anti ADAR1 antibodies. RK13 cells were either mock infected or infected with the Copenhagen and WR strains of Wt VV, VVE3L::ADAR1, VVE3L::ADAR1cat- and VVE3L83N viruses at an MOI of 1. Cell lysates were prepared at 4 hours post infection using NP40 lysis buffer. The proteins were resolved on a 7.5% SDS PAGE gel followed by western blotting using antibodies to ADAR protein.
VVE3L::ADAR1cat- VVE3L::ADAR1 VVDE3L Wt VV Mock ADAR1 E3L Figure 3. Poly(rI).poly(rC)-agarose binding assay. 100 mm dishes of RK13 cells were either mock infected or infected with Wt VV, VVE3L, VVE3L::ADAR1and VVE3L::ADAR1cat-viruses at an MOI of 1. Following infection, cells were radio-labeled with [35S] methionine between 3-5 hours post infection. At 5 hours post infection cells were harvested and NP40 lysates were prepared. The lysates were incubated with pre-washed poly(rI).poly(rC)-agarose resin for one hour at 4C. Following incubation, the resin was washed with buffer A to remove excess unbound protein and radioactivity. The proteins that bound to the resin were resolved on a 7.5-12% gradient SDS-PAGE gel and subjected to autoradiography.
120 100 Wt VV 80 o o o VV E3L VVE3L 83N 60 Percent plaque reduction VVE3L::ADAR1 40 VVE3L::ADAR1cat- o 20 o 0 0 0.1 1 10 100 1000 Units of interferon/mL Figure 4. Interferon sensitivity assay. RK13 cells were pretreated with increasing doses of interferon (unit/mL) for 16 hours, followed by infection with 1x10² pfu of Wt VV, VVE3L, VVE3L83N, VVE3L::ADAR1 and VVE3L::ADAR1cat-viruses. Cells were stained 36 hours post infection with crystal violet and the number of plaques were counted. The reduction in the number of plaques was recorded as a percentage of plaques in the absence of interferon and was plotted against increasing units of interferon.
Effeciency of plaquing Wt VV= 0.8 VVE3L= <0.0001 VVE3L83N= 0.66 VVE3L::ADAR1= 0.06 VVE3L::ADAR1cat-= <0.0001 VV E3L 83N E3L VV Wt VV VVE3L:: ADAR1cat- VVE3L:: ADAR1 Figure 5. Determination of host range. HeLa and RK13 cells were infected with increasing doses of Wt VV, VVE3L,VVE3L83N, VVE3L::ADAR1 and VVE3L::ADAR1cat-viruses. This was followed by staining with crystal violet at 36 hours post infection. The number of plaques were counted and the titers of the viruses were determined in HeLa and RK13 cell lines. The titers of the viruses in HeLa and RK13 cell lines are plotted above. The panel on the right shows the efficiency of plaquing which is determined by dividing the virus titer on HeLa monolayers by the titer on RK13 monolayers.
VVE3L::ADAR1cat- VVE3L::ADAR1 VVE3L83N VVE3L Wt VV Mock Figure 6. Protein synthesis assay. HeLa cells were either mock infected or infected with VVE3L, VVE3L83N, Wt VV,VVE3L::ADAR1andVVE3L::ADAR1cat-viruses at an MOI of 1. The cells were radio-labeled with [35S] methionine between 5-6 hours post infection. Cells were harvested at 6 hours post infection and lysates were prepared. The lysates were resolved on a 12% SDS-PAGE gel and subjected to autoradiography.
4 HPI 6 HPI VVE3L::ADAR1cat- VVE3L::ADAR1cat- VVE3L::ADAR1 VVE3L::ADAR1 VVDE3L VVDE3L Wt VV Wt VV Mock eIF2a-P Figure 7. eIF2 phosphorylation assay. HeLa cells were either mock infected or infected with Wt VV, VVE3L,VVE3L83N, VVE3L::ADAR1and VVE3L::ADAR1cat-viruses at an MOI of 1. Cell were harvested at 4 and 6 hours post infection and lysates were prepared using RIPA lysis buffer. The proteins were resolved on a 12% SDS PAGE gel followed by western blotting using antibodies to the phosphorylated form of eukaryotic translation initiation factor2 (eIF2).
VV E3L 83N E3L VVE3L:: ADAR1cat- VVE3L:: ADAR1 Wt VV VV Figure 8. Single step growth curve. 60 mm dishes of HeLa cells were infected in duplicate with Wt VV, VVE3L, VVE3L83N, VVE3L::ADAR1 and VVE3L::ADAR1cat-viruses at an MOI of 1. At 0 hours post infection one set of dishes were rinsed with warm 1x PBS (3 times) and harvested. The second set of dishes was harvested in a similar manner at 30 hours post infection. The virus titers in the harvested cell suspensions (from 0 and 30 hours post infections) were determined by titering the viruses in RK13 cell line. The above graph compares the titers of the viruses at 0 and 30 hours post infection.
VV E3L 83N E3L VVE3L:: ADAR1 Wt VV VV VVE3L:: ADAR1cat- Figure 9. Multi step growth curve. 60 mm dishes of HeLa cells were infected in duplicate with Wt VV, VVE3L, VVE3L83N, VVE3L::ADAR1 and VVE3L::ADAR1cat-viruses at an MOI of 0.01. At 0 hours post infection one set of dishes were rinsed with warm 1x PBS (3 times) and harvested. The second set of dishes was harvested in a similar manner at 72 hours post infection. The virus titers in the harvested cell suspensions (from 0 and 72 hours post infections) were determined by titering the viruses in RK13 cell line. The above graph compares the titers of the viruses at 0 and 72 hours post infection.
% Survival cat- Virus Dose (pfu) Figure 10. Percent survival of mice infected by intracranial route. Groups of 4-6 mice were injected intracranially with increasing doses of Wt VV, VVE3L, VVE3L83N, VVE3L::ADAR1 and VVE3L::ADAR1cat- viruses. Mice were monitored for 14 days after injections. The percentage of mice that survived at the end of 14 days was plotted against the dose of virus administered