Download
1 / 1
20 likes | 184 Vues
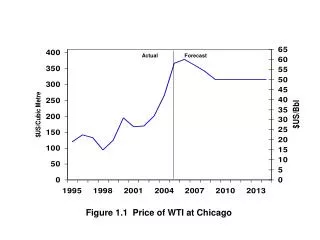
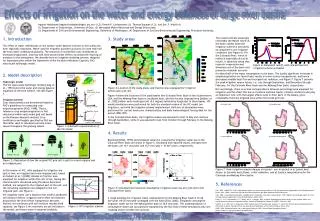
Energy and moisture fluxes. Vegetation cover. 2. ...N. 1. N+1. R S. S. R L. E t. E c. L. Infiltration capacity. τ G. E. Canopy. R. Layer 0. Fraction of area. Layer 1. Baseflow Curve. Layer 2. B. Baseflow, B. Layer 2 soil moisture. +. Original VIC cell. Non-irrigated.

E N D
Energy and moisture fluxes Vegetation cover 2 ...N 1 N+1 RS S RL Et Ec L Infiltration capacity τG E Canopy R Layer 0 Fraction of area Layer 1 Baseflow Curve Layer 2 B Baseflow, B Layer 2 soil moisture + Original VIC cell Non-irrigated Irrigation starts Field capacity Soil moisture Critical soil moisture Time Effects of irrigation on the water and energy balances of large river basins Ingjerd Haddeland (ingjerd.haddeland@geo.uio.no) (1,2), Dennis P. Lettenmaier (3), Thomas Skaugen (1,2), and Eric F. Wood (4). (1) Department of Geosciences, University of Oslo, (2) Norwegian Water Resources and Energy Directorate, (3) Department of Civil and Environmental Engineering, University of Washington, (4) Department of Civil and Environmental Engineering, Princeton University. The results indicate seasonally noticeably decreased runoff at the basin outlets when the irrigation scheme is activated, as compared to non-irrigated conditions (see Figure 6). For the Colorado River, which in reality is essentially dry at its mouth, it should be noted that reservoir evaporation and diversions out of the basin (not presently modeled) accounts 1. Introduction The effect of water withdrawals on the surface water balance is known to be locally and even regionally important. Water used for irrigation purposes accounts for more than half the total water withdrawals globally. The reduction in streamflow now contributes to increased evaporation, and may well have second order effects via enhanced recycling of moisture to the atmosphere. We describe here an irrigation modeling scheme, designed for implementation within the framework of the Variable Infiltration Capacity (VIC) macroscale hydrologic model. 3. Study areas Figure 6: Simulated runoff, with and without the irrigation scheme activated. for about half of the water consumption in the basin. The locally significant increases in evapotranspiration (or latent heat) results in lower surface temperatures, and hence decreased sensible heat flux and increased net radiation, see Figure 7. Figure 7 presents the peak irrigation season values, i.e. July through September, and December through February, for the Colorado River basin and the Mekong River basin, respectively. Not surprisingly, there is a close correspondence between percentage area equipped for irrigation and the effect this has on moisture and heat fluxes. Climate conditions also play an important role, with the largest effects seen in drier parts of the basins, given comparable fractions irrigated area within the model grid cell. 2. Model description Hydrologic model The VIC macroscale hydrologic model [Liang et al., 1994] solves the water and energy balance equations at the land surface. See also Figure 1. Irrigation scheme Crop characteristics are determined based on FAO’s guidelines for computing crop evapotranspiration [FAO, 1998].That is, reference crop evapotranspiration is first calculated within each model grid cell based onthePenman-Monteith method. Crop coefficients and heights specified by FAO are thereafter used to calculate leaf area index values throughout the growing season. Area: 630000 km2 Area: 795000 km2 Figure 4: Location of the study areas, and fraction area equipped for irrigation within each grid cell. Variable Infiltration Curve Figure 4 shows the locations of the study basins (the Colorado River basin in the Southwestern USA, and the Mekong River basin in Southeast Asia), and the fraction irrigated area [Siebert et al., 2002] within each model grid cell (0.5 degrees latitude by longitude) of these basins. VIC model simulations were performed for both the standard version of the VIC model (no irrigation), and with the irrigation scheme implemented. Both sets of simulations were performed for current land cover characteristics and daily meteorological forcing data for the period 1980-1999. In the Colorado River basin, the irrigation season was assumed to start in May and continue through September, while it was assumed to last from October through February in the Mekong River basin. a) Latent heat b) Sensible heat Figure 1: Schematic representation of the VIC model. 4. Results Reported [USGS, 1999] and simulated values for consumptive irrigation water use in the Colorado River basin are shown in Figure 5. Simulated and reported values, averaged over the basin, are 14.1 mm/year and 15.9 mm/year (~10 km3/year), respectively. c) Net radiation d) Surface temperature Irrigated Figure 2: Illustration of how the original VIC grid cell is split in a non-irrigated and an irrigated part. In this version of VIC, cells equipped for irrigation are split in two; an irrigated and a non-irrigated part, based on Siebert et al.’s [2002] dataset on fraction area equipped for irrigation within the cell. Crops, having the characteristics calculated using the above described method, are assigned to the irrigated part of the cell, and the remaining vegetation are assigned to the non-irrigated part, see Figure 2. VIC irrigation water use is based on the model’s predicted soil moisture deficit. Irrigation starts when soil moisture drops below the level where transpiration becomes limited, and continues until soil moisture reaches field capacity, see Figure 3. No reservoirs are yet included in the model, and hence water is assumed available. Figure 7: Peak irrigation season changes (irrigated – non-irrigated)in a) Latent heat fluxes, b) Sensible heat fluxes, c) Net radiation, and d) Surface temperatures for the Colorado and Mekong River basins. Irrigation ends 5. References FAO, 2003, AQUASTAT: FAO’s information system on water and agriculture, Food and Agriculture Organization of the United Nations, Rome, Italy. (http://www.fao.org/waicent/faoinfo/agricult/agl/aglw/aquastat/main/index.stm) FAO, 1998, Crop evapotranspiration, Guidelines for computing crop water requirements, FAO Irrigation and drainage paper 56, Food and Agriculture Organization of the United Nations, Rome, Italy. Liang, X., D. P. Lettenmaier, E. F. Wood, and S. J. Burges, 1994, A simple hydrologically based model of land surface water and energy fluxes for general circulation models, Journal of Geophysical Research, 99(D7), 14,415-14,428. Siebert, S., P. Döll, and J. Hoogeveen, 2002, Global map of irrigated areas version 2.1, Center for Environmental Systems Research, University of Kassel, Germany/Food and Agriculture Organization of the United Nations, Rome, Italy. USGS, 1999, Estimated water use in the United States in 1995, United States Geological Survey (http://water.er.usgs.gov/watuse/spread95.html). Figure 5: Simulated and reported consumptive irrigation water use per grid cell in the Colorado River basin. A rough estimate for irrigation water requirements for the Mekong River basin is 15-20 km3/year (19-25 mm/year) averaged over the basin [FAO, 2003]. Simulated consumptive irrigation water use for the Mekong River basin is 16.6 mm/year. The underestimation of consumptive water use can partly be explained by the fact that in these simulations only one cropping season is taken into account. Figure 3: VIC irrigation scheme. Global Water System Project - Open Science Conference, 7-9 October 2003