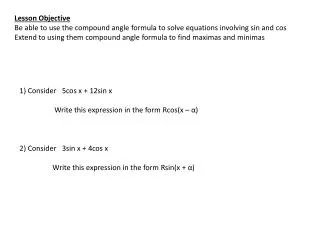
Mean Calculation for Frequency Distribution
170 likes | 282 Vues
Learn how to find the mean of a frequency distribution by calculating midpoints, multiplying midpoints by frequencies, and applying the formula. Practice with examples provided.

Mean Calculation for Frequency Distribution
E N D
Presentation Transcript
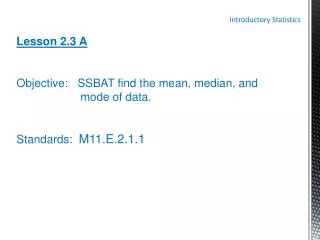
Introductory Statistics Lesson 2.3 C Objective: SSBAT find the mean of a frequency distribution. Standards: M11.E.2.1.1
Mean of a Frequency Distribution = Where: x is the midpoint of a class and f is the frequency of that class
Mean of a Frequency Distribution (in words) Find the Midpoint of each class Multiply the midpoint of each row and its frequency together Add all of the products together from step 2 Add all the individual frequencies together (Σf) Divide the answer from Step 3 by the answer from step 4
= Example 1 The heights (in inches) of 18 female students in a physical education class are listed in the frequency distribution below. Find the mean of the distribution. 1st: Find the Midpoint of each class
Example 1 continued 1st: Find the midpoint of each class 2nd: Find (x · f) Frequency times Midpoint
Example 1 continued 2nd: Find (x · f) 3rd: Find Σf and Σ (x·f)
Example 1 continued 3rd: Find Σf and Σ (x·f) 4th: Divide Σ(x · f) by
Example 1 continued = = 65
= Example 2 Use the frequency distribution below to find the mean number of minutes that a sample of Internet subscribers spent online during their most recent session. xf 75 245 474.5 388 302.5 435 169 50 2089
Example 2 continued. = = 41.78
The frequency distribution shows the number of touchdowns scored by team during a season. Find the Mean of the Distribution.
3. Continued. 19.5 29.5 39.5 49.5 59.5 69.5
3. Continued. 312 1003 1185 1138.5 773.5 139 n = 118 4551
Continued. = = 38.57
Homework Worksheet 2.3 C