Banco do Brasil 2Q05 Results Highlights: Key Financial Metrics and Insights
In the second quarter of 2005, Banco do Brasil reported notable financial results, including a net income rise, improved efficiency ratios, and a stable return on equity (ROE). Key metrics showcased include an ROE of 29.6%, net interest income of R$4,146 million, and a BIS ratio of 15.9%. Additionally, the bank demonstrated an improved delinquency rate of 3.1%. The presentation highlights key financial insights and the bank’s strategic performance in the Brazilian banking sector, alongside risks and projections for future growth.


Banco do Brasil 2Q05 Results Highlights: Key Financial Metrics and Insights
E N D
Presentation Transcript
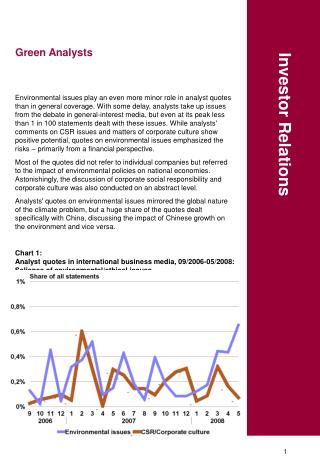
Investor Relations BANCO DO BRASIL 2Q05 Results
Highlights R$ million (1) Equity Income + Other Operating Income (2) Taxes on Revenues + Other Tax Expenses + Other Operating Expenses + Legal Risk
Highlights R$ million 2Q04 1Q05 2Q05 1H04 1H05 Spread - % 9.2 8.4 9.0 8.7 8.6 Deliquency ¹ - % 3.2 3.1 3.1 3.2 3.1 Efficiency 59.0 56.1 49.6 56.6 52.8 ROE ² - % 27.7 29.3 29.6 23.9 28.6 ROE Recurrent ² - % 23.9 24.5 29.6 28.8 26.4 ROA ² - % 1.4 1.6 1.7 1.2 1.7 BIS Ratio - % 14.5 15.6 15.9 14.5 15.9 (1) Past Due Loans + 60 days (2) Annualized
1.014 965 162 116 55 Net Income 2Q05 Net Income 1Q05 (43) (55) (87) (99) Net Interest Income Service Revenues Administrative Expenses Taxes on Revenues Other Taxes Profit Sharing Result Changes Net Income Changes - R$ million
4,090 4,086 3,925 3,919 Net Interest Income - R$ million NIM¹ Annualized - % Net Interest Income 4,146 Spread by Credit Portfolio - % 2Q04 3Q04 4Q04 1Q05 2Q05 43.0 40.4 38.1 35.9 35.5 9.1 8.7 8.3 8.0 7.9 7.0 6.0 5.8 5.8 5.4 2Q04 3Q04 4Q04 1Q05 2Q05 Agribusiness Commercial Retail (1) Net Interest Margin - Related to Earning Assets
Volume and Spread Analysis Spread - % 2Q04 - 1.7896 (22) (1) 2Q05 - 1.7795 3,925 245 Volume - R$ million 2Q05 - 232,988 2Q04 - 219,318 Spread - % 1H05 - 3.4716 27 2 Gain due to Volume 1H04 - 3.4597 Gain due to Spread Gain due to Volume and Spread 7,754 454 Volume - R$ million 1H05 - 237,240 1H04 - 224,132
Loan Portfolio R$ million 2Q04 - % 1Q05 - % 2Q05 - % 10.1 9.5 13.3 18.3 18.6 18.3 12.7 13.5 13.5 30.8 33.0 33.5 25.0 25.1 24.9 Individuals SMEs Businesses Agribusiness Abroad
Quarterly Provision Expenses Provision Expenses / Loan Portfolio ¹ - % Delinquency and Provision for Credit Risks 4.4 4.4 4.3 4.3 4.2 1,061 1,002 903 868 856 6.4 2Q04 3Q04 4Q04 1Q05 2Q05 6.1 6.1 6.1 6.1 5.6 5.1 5.1 5.1 4.9 3.2 3.3 3.2 3.1 3.1 2Q04 3Q04 4Q04 1Q05 2Q05 Allowance for loan losses / Loan Portfolio - % Past Due Loans / Loan Portfolio - % Past Due Loans + 60 days / Loan Portfolio - % (1) Average Portfolio - 12 months and Annualized Income
Credit Risk - % 8.5 10.2 12.8 5.2 2.1 2.0 6.0 97.9 98.0 91.5 94.8 94.0 89.8 87.2 Retail Commercial Agribusiness Foreign Trade Abroad BB Banking Industry¹ AA-C D-H (1) Source: Brazilian Central Bank
296 286 286 282 287 Service Revenues R$ million Account Holders Base - million Asset Under Management - R$ billion 21.3 20.8 19.9 20.0 19.7 144.8 138.2 21.9 21.2 21.1 20.7 124.0 122.5 20.1 116.9 2Q04 3Q04 4Q04 1Q05 2Q05 2Q04 3Q04 4Q04 1Q05 2Q05 Customers Fees + NII¹/ Average² Customers Base - R$ AUM Market Share - % (1) Net Interest Income (2) 12 Months
Administrative Expenses R$ million
Productivity Ratios Assets per Workforce - R$ thousand 2,570 2,597 2,531 2,455 2,413 2Q04 3Q04 4Q04 1Q05 2Q05 Customers per Workforce Workforce per Branch ¹ 227 224 226 17.6 18.1 221 17.4 17.4 17.3 217 2Q04 3Q04 4Q04 1Q05 2Q05 2Q04 3Q04 4Q04 1Q05 2Q05 (1) Branch + Advanced Service Post + Banking Service Post
Productivity Ratios Loan Portfolio per Point of Service - R$ million 6.6 6.4 6.1 6.0 5.9 2Q04 3Q04 4Q04 1Q05 2Q05 Serv. Rev. per Point of Service - R$ thousand Customers per Point of Service 132 121 121 1,501 118 118 1,459 1,457 1,448 1,442 2Q04 3Q04 4Q04 1Q05 2Q05 2Q04 3Q04 4Q04 1Q05 2Q05
Productivity Ratios Coverage Ratio ¹ - % YTD 108.2 98.3 98.4 97.9 96.8 2Q04 3Q04 4Q04 1Q05 2Q05 Efficiency Ratio ² - % YTD Efficiency Ratio Change 58.2 56.7 56.6 56.1 52.8 R$ million 2Q04 3Q04 4Q04 1Q05 2Q05 (1) Service Revenues / Personnel Expenses (2) Administrative Expenses / Operating Income
Pretax Income - R$ million Taxes - R$ million Tax Rate - % Income Tax and Social Contribution 37.7 32.4 30.2 17.3 1,760 1,601 3.9 1,445 1,184 1,083 570 545 483 187 47 2Q04 3Q04 4Q04 1Q05 2Q05
For further information access www.bb.com.br/ri Investor Relations Division SBS - Quadra 1 - Bloco C - Ed. Sede III - 17° floor 70073-901 - Brasília (DF) Phone: 55 (61) 310.5920 Fax: 55 (61) 310.3735 www.bb.com.br ri@bb.com.br Disclaimer- This presentation contains references and statements, planned synergies, increasing estimates, projections of results and future strategy for Banco do Brasil, it’s Associated and Affiliated Companies and Subsidiaries. Although these references and statements reflect the management’s belief, it also involves imprecision and high difficult risks to be foreseen, consequently, it may conduct to a different result than the one anticipated here. These expectations are highly depended on market conditions, on the Brazilian economic performance, on the sector and the international market. Banco do Brasil is not responsible for bringing up to date any estimate in this presentation.