Download
1 / 39
390 likes | 561 Vues
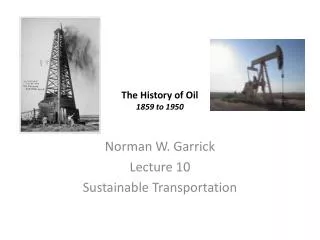
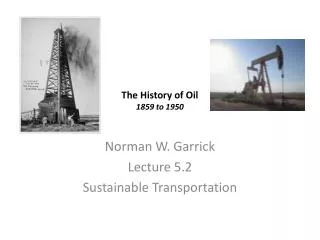
The History of Oil Since 1950. Norman W. Garrick Lecture 6 Sustainable Transportation. Based mostly on Kunstler, The Long Emergency , 2005, Atlantic Monthly Press, New York, pg. 73-87 (Chapter 2: Modernity and the Fossil Fuels Dilemma). Hubbert’s Curve I Predicting the American Peak.

E N D
The History of OilSince 1950 Norman W. Garrick Lecture 6 Sustainable Transportation
Based mostly on Kunstler, The Long Emergency, 2005, Atlantic Monthly Press, New York, pg. 73-87 (Chapter 2: Modernity and the Fossil Fuels Dilemma)
Hubbert’s Curve IPredicting the American Peak In the 1940s M. King Hubbert developed a model for describing the geological limits of oil supply In 1956 he predicted that the US Peak would occur between 1966 and 1972 Even though Hubbert was was a well respected, well connected geologist (He was a geology professor at Columbia and had been chief of research at Shell Oil) He was not believed
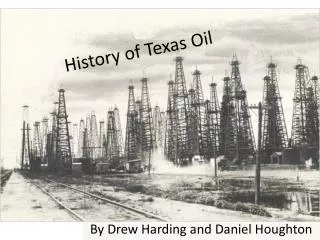
The Mythology and Science of Peak Oil In the early years of oil, no one knew how much oil was on the planet And how long it would last Were locations with oil relatively rare? Or were there untold reserves under the ground? As the fields of the east in Pennsylvania, Ohio and Indiana played out Some thought the petroleum era would be as transient as the whale oil era However, the discovery of giant fields in Texas, Oklahoma And then, California, Mexico, Venezuela and other places calmed the fear
The Rise of Foreign Oil Hubbert’s model was based on relating trends in discovery and production What he realized was that discovery of oil in America peaked in the 1930s One reason that no one paid attention to Hubbert’s prediction was that the rate of discovery was exploding in other places In 1948 the world’s reserve was 64 Billion Barrels By 1972 it had expanded to 534 Billion Barrels Almost all outside of the USA This explosion in discovery led to a 28 year glut in supply The US responded by using quotas to keep out foreign oil
Peak Discovery and Peak Production http://www.grinningplanet.com/2005/06-14/peak-oil-article.htm
1967 Testing the Embargo Card The first attempt at using an oil embargo was attempted by Saudi Arabia After the 6 day war in 1967 It did not work America still had spare capacity and was able to just increase production
1970 The American Peak In 1970 US production peaked No one knew it at the time In 1970 the US produced 11.3 million barrels/day By the mid-1980s the production was 9 million barrels/day It was down to about 5 million barrels/day Now it is back up to about 6 million barrels/day After 1970, American oil imports sky rocketed After peak, imports went from 2.2 million barrels/day To 6 million barrels/day in 1973 Hubbert had been right And Saudi Arabia was now in charge
1970 The American Peak http://www.grinningplanet.com/2005/06-14/peak-oil-article.htm
1970 The American Peak http://gailtheactuary.wordpress.com/2007/03/16/oil-quiz-test-your-knowledge/
1970 The American Peak http://ocho.uwaterloo.ca/~pfieguth/Personal/EnergyLimits/Figures/US_Oil_Production_and_Imports_1920_to_2005.png
Recent Upturn in Production http://www.eia.gov/dnav/pet/hist/LeafHandler.ashx?n=PET&s=MCRFPUS1&f=A US Energy Information Administration
1973 The First Oil Shock By 1973, Saudi Arabia had tremendous surplus capacity America had peaked and had lost it surplus Also world wide demand was soaring 19 million barrels/day in 1960 44 million barrels/day in 1972 When the 1973 Yom Kippur War precipitated an OPEC embargo There was no surplus left to soften the effects
1973 The First Oil Shock NBC Nightly News coverage of OPEC's decision to cut exports of oil to the United States along with other nations. Reported by John Chancellor of the evening of October, 17 1973. http://www.youtube.com/watch?feature=player_embedded&v=VCLRlVxOH-Q
http://www.heatingoil.com/articles/arab-oil-embargo-happened-happen/http://www.heatingoil.com/articles/arab-oil-embargo-happened-happen/ http://automotivemileposts.com/garage/v5n2.html
1973The Impact of the Shock In 1973 the Arab nations proposed an embargo on the USA and increased price 70% for Europe This had a significant impact worldwide Although the embargo did not shut down supply to the USA Oil found its way to America but in circuitous way The result was devastating In six months: Price quadrupled Long lines formed at gas stations with fights at the pumps Odd/even license plate system used to manage supplies Daylight Savings Time was extended No Sunday Sales Ration stamps printed but not used
1973The Economic Impact Stock prices dropped 45% Inflation took off, accompanied by high interest rate The economy suffered from stagflation The US recession was the worst since 1930s “OPEC embargo and its aftershocks represented a unique crisis of a fossil fuel-addicted industrial civilization” The embargo lasted just 7 months, but the effects lingered for years
1973The Auto Industry The US auto industry was devastated Europe and Japan offered small fuel efficient cars In contrast the US offerings looked like lumbering dinosaurs The US auto industry never fully recovered
Hubbert’s Curve IIThe Worldwide Peak Hubbert’s model showed that world oil discovery peaked in 1960 His initial model suggests a world wide peak between 1990 and 2000 That has been revised to between 2000 and 2010
All the Oil in the World The total endowment of conventional liquid petroleum that ever existed on earth was 2 Trillion Barrels 2,000,000,000,000 Peak 1 Trillion left < 34 years 1 Trillion left 1 Trillion gone Mostly since 1950 Current consumption: 80 million barrels/day = 29 billion barrels/year 1,000,000,000,000/29,000,000,000 = 34 years This calculation does not account for increase in consumption
The Last Trillion The last trillion will be much harder to recover than the first trillion Much of it may even require more energy to recover than it will yield Also there is likely to be intense competition which will aggravate the cost Peak 1 Trillion left < 34 years 1 Trillion left 1 Trillion gone Mostly since 1950
http://www.worldalmanac.com/blog/2008/01/world_oil_reserves_and_consumption.htmlhttp://www.worldalmanac.com/blog/2008/01/world_oil_reserves_and_consumption.html
1979The Second Oil Shock This was precipitated by the Iran revolution In 1979 Iran produced only 5% of the worlds supply But with OPEC now controlling the oil market The loss of this production sent shock waves around the world Prices tripled at the gas pump Gas lines returned Inflation rekindled This crisis went on longer than the 1973 OPEC embargo The crisis was exacerbated by the Iran hostage crisis and the Iran/Iraq war which took 8% of the worlds production offline
1980s and 1990sA Reprieve for the West The Alaska North Shore fields were discovered in the 1960s The North Sea oil fields (controlled by the UK and Norway) were also discovered in the 1960s These fields came on board in the mid to late 1970s But all at tremendous cost In the case of Alaska It required the building of a 800 mile pipeline costing $10b (1970 prices) For the North Sea Oil It required the development of expensive deep sea drilling technology The OPEC Oil Embargo was what made this extraordinary effort worthwhile But the embargo also caused other changes which led to more supply and less demand
1985A 15 Year Oil Glut More Supply By the mid-1980s there was a glut in oil supply The price increases led to more drilling and more exploration Especially in deep sea locations So in addition to the Alaska and North Sea fields We also saw development of the fields in the Gulf of Mexico At the same time the Soviets stepped up production More Demand Demand fell during the recessions due to the higher prices And there was a move to more fuel efficient (foreign made) cars
1985Cheap Oil: A Return of the Good Old Days Many businesses benefited from the glut and low oil prices US Oil company suffered and exploration was shut down Houston and Tulsa went into a tailspin Most importantly, the American public saw low prices as a return to normal With President Reagan as the cheerleader in chief, Energy was no longer a major US political issue • Kunstler The public saw 1973 and 1979 as anomalous manipulations by “them”
Mid 1980s - 2000The Role of Saudi Arabia During the glut, OPEC took on the role of stabilizing prices By maintaining a production quota This system was successful in keeping prices at around $17 for a decade or so Saudi Arabia played a key role Acting as a swing producer to moderate global supply Saudi Arabia saw it in their interest to level out the peaks and valleys
1991The First Gulf War The war was precipitated by the Iraqi invasion of Kuwait (10% of worlds reserve) The US coalition quickly ejected Saddam Oil prices were barely affected And in fact, fell to under $20 during the war And stayed at that level into the 2000 With a major assist by the Saudis
The 1990sGlobalization, SUVs, MacMansions, and Monica L. Kunstler characterizes the 1990s as the era when we Outsourced industry to Asia And focused on hypertrophic** suburban land development and consumerism Leading to the need for more oil than ever With proportionately more being used for transportation SUVs took over with their exemption from fuel efficiency standards ** Hypertrophy is the increase in the volume of an organ or tissue due to the enlargement of its component cells
The 1990sGlobalization, SUVs, MacMansions, and Monica L. If Bill Clinton had any reservation about the economy becoming hostage to the creation of suburban sprawl he never voiced them. Like a lot of sunbelters, he might have viewed sprawl as good to live in and good for business Relative calm lead the public to pre-occupation with trivialities such as the public sex life of the president • Kunstler
2000-2010Crunch Time According to Kunstler 9-11 coincided with strange happenings in the oil market Around this time crude price began to drift Above the $20 per barrel that the Saudis desired By 2003 price was ratcheting up Also demand was raising especially from China Although the Saudis claimed excess capacity Production was not raising to meet the new demand!
2000-2010Do we really know how much oil we have? That same year, 2004, it was revealed that reserves in Venezuela was inflated by 20% This lead to suspicion that other countries had also inflated reserves Including Saudi Arabia! In fact, it was suspected that Saudi Arabia had peaked 15 years early
2010Are We Past Peak? In the early 2000s, a Princeton geologist, Ken Deffeyes suggested that peak oil had occurred in 2001 He later revised this estimate to 2005 Based on events since then he might well have been right We don’t know yet
2010Epilogue I think what Dr. Deffeyes may be trying to tell us is this: Let us give thanks for this extraordinary period of human history we lived through. Let’s recognize that we are moving into a new phase of history. Let’s be brave and wise about it and prepare to more on • Kunstler