Download
1 / 14
140 likes | 313 Vues
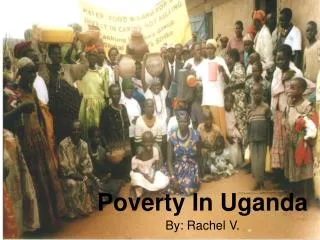
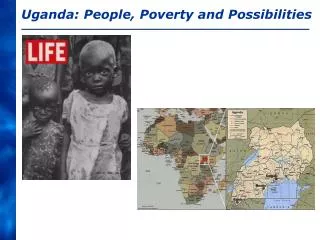
Census-Based Welfare Estimates for Small Populations Poverty and Disability in Uganda. HD week Hans Hoogeveen. Poverty profiles are limited. Poverty profiles are almost exclusively based on information available in LSMS-type surveys

E N D
Census-Based Welfare Estimates for Small PopulationsPoverty and Disability in Uganda HD week Hans Hoogeveen
Poverty profiles are limited • Poverty profiles are almost exclusively based on information available in LSMS-type surveys • Education, age, housing characteristics, family size, spatial • Information for small target populations is absent • Statistical invisibility of poverty amongst vulnerable groups • People with disabilities • Child headed households • Ethnic minorities
Poverty profiles are limited • Illustration: regional poverty in Uganda in 1992, according to IHS Rural Urban P(0) Std.e P(0) Std.e Central 54.1 2.2 21.0 3.1 East 60.6 2.3 39.8 4.0 North 74.3 2.9 49.4 5.4 West 54.4 2.5 32.8 3.5 • Why not combine surveys with other data sets? • E.g. combine with census data to get spatial detail
Disaggregating spatially • Uganda poverty map • Poverty estimates at LC3 level • Small standard errors
Disaggregating by disability • Some censuses also provide information on disability • Uganda (1991, 2002); Tanzania (2000) • Aruba (1991); Bahamas (1990, 2000); Bahrain (1991, 2001); Bangladesh (2001); Belize (1991, 2000); • Bermuda (1991); Botswana (1991) • Census manual defines disability as any condition which prevents a person from living a normal social and working live. • Head of household is considered disabled if this prevents him/her from being actively engaged in labor activities during the past week
Combining census and survey data Elbers, Lanjouw & Lanjouw, econometrica 2003 • Estimate with IHS : • Predict with census: • Calculate welfare stat:
Data • 1991 Population and Housing census • Long form with info on disability • Administered in urban areas only • 22,165 households with disabled head (5% of total) • 425,333 households with non-disabled head • 1992 IHS • Consumption aggregate • Information on disability is absent • 4 urban strata
Is poverty under-estimated? • Reconsider the model estimated in survey • Survey comprises no information on disability • Strictly speaking not correct, we also include census means and their interactions with household characteristics • Only correlates of disability are captured • Education, age, household size, female headed, marital stat. • Housing conditions, toilet, access to safe water • Location means capturing employment etc. • ’s are the same for disabled and non-disabled • E.g. return to education could be different
Is poverty under-estimated? • We estimate • The model we would like to estimate is: • If ’s would be negative, ch is negative for disabled hh’s • predicted consumption is too high, poverty is under-estimated • If ’s would be positive, ch is positive for disabled hh’s • predicted consumption is too low, poverty is over-estimated
Conclusion • Combining census and survey data gives new insights • Spatial poverty profile • Poverty amongst small target populations • Poverty amongst households with disabled head is 38% higher • Method can be used for other vulnerable groups • Child headed households • Elderly • Ethnic minorities • People in hazardous occupation • Caveat: estimates are an lower or upper bound