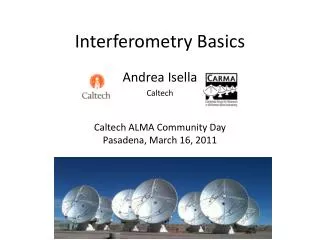
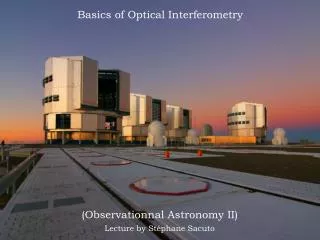
Basics of Optical Interferometry
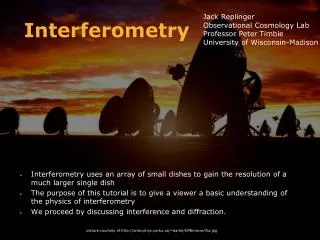
Basics of Optical Interferometry. (Observationnal Astronomy II) Lecture by Stéphane Sacuto. Source with F s < l /D. PSF. The information on your object is lost. You NEED more spatial resolution from your instrument. . Power of Resolution and need for High Angular Resolution. D.

Basics of Optical Interferometry
E N D
Presentation Transcript
Basics of Optical Interferometry (Observationnal Astronomy II) Lecture by Stéphane Sacuto
Source withFs< l/D PSF The information on your object is lost. You NEED more spatial resolution from your instrument. Power of Resolution and need for High Angular Resolution D PSF IObj
Typical monolithic telescope diameters Those structures are not resolved with monolithic telescopes even with the ELT We need something else INTERFEROMETRY
but Fs~ l/B < l/D D D B PSF Interferometric signal Source withFs< l/D D The signal of the source is found again but under the appearance of fringes
L1 z L2 L3 DL=L1 =B.cosz Delay line and optical path compensation Bp=B.sin(z) B
+ Fs An Interferometer is measuring the contrast of the total fringe pattern : PSF of the telescope Fringe contrast is given by : Imax - Imin Interferometric signal V Imax + Imin l/B l/D The interferometric signal
High contrast Mid contrast Low contrast V~1 V~0.6 V~0.2 The fringe contrast (part I) • For a given baseline length Band for different sizes of the source Fs Small source (Fs<<l/B) Mid source (Fs ~ l/B) Large source (Fs ~ l/D)
High contrast Mid contrast Low contrast V~1 V~0.6 V~0.2 The fringe contrast (part II) • For a given dimension of the source Fsand for different baseline lengths B Mid base (B ~ l/Fs) Large base (B >> l/Fs) Small base (B<<l/Fs)
? Object-Contrast Relation The Van Cittert and Zernike theorem V= |Ô (u,v)/Ô(0,0) |
Fourier space/uv-plane/ spatial frequencies plane |Ô (u,v) /Ô (0,0)| Direct Space O(a,d) v F d u a v d òò O(a,d) . exp[-i.2p (ua +vd)]. da dd òò O(a,d) . da dd u a v d Does someone recognize this denominator? u a The Van Cittert and Zernike theorem The fringe contrast of a source of emissivity O is equal to the modulus of the Fourier Transform of O at a given spatial frequency normalized by the FT of O at the origin.
Some Fourier (Hankel) transformations (*) r = (a² + d²)1/2 (*) q = (u ² + v ²)1/2 = Bp/l (**) J1c(X) = J1(X)/X
Plane of the star Plane of the star T1 T0 BY By Bp=100 m PA Bp=B=130 m Bx PA Earth plane PA Bx u = Bx/l = Bp.cos(PA) / l v = By/l = Bp.sin(PA) / l After an Earth rotation Bp/l = Öu² + v² The uv-plane (part I) spatial frequencies(u,v) : coordinates (Bx,By) of the projected baselines (Bp) seen from the star and divided by the observing wavelength(l)
after 6 hours after 42 hours with 7 pairs after 1 hour of observation Wavelength dispersion (u=Bx/l ; v=By/l) d d d d d d v v v v v v ?? ?? ?? = = = u u u u u u a a a a a a The uv-plane (part II) Observation of R Scl (a=01:26:58 ; d=-32:32:35) at the date of 19 August 2011 This kind of coverage is very expensive in time ! Observations F F-1
Is it really necessary to get a very large uv-coverage for such an object? [hot star] Is it necessary to get a very large uv-coverage for this one? [Post-AGB (triple system + envelope + disk)] What is the appropriate uv coverage? It depends on the complexity of the object
MgFeSiO4 Fe Mg2SiO4 Al2O3 TiO2 SiO2 Mg2SiO4 Al2O3 TiO2 SiO SiO2 H2O TiO C2H2 HCN SiC SiC AmC SiC AmC 5R 1R 2R 3R 6R 4R • Spectral information B=30m (outer dusty region) B=60m (mid dusty region) B=90m (inner dusty region) B=120m (molecular region)
Binary source at anglea0 => • displacement of the fringes byOPD = a0.B a0 Van Cittert-Zernike theorem f(u,v) = arg[Ô(u,v)] = atan[Im(Ô)/Re(Ô)] B information on the asymmetries of an object a0.B Atmospheric noise The Phase in Interferometry: V = V e-i 12 = 12obj + d2 – d1
Observed Object Atmosphere 12 = 12obj + d2 –d1 23 = 23obj + d3– d2 31 = 31obj + d1–d3 123 = 12 + 23 + 31= 12obj + 23obj + 31obj The Closure Phase T1 T2 T3 Object Only!!
An Example UD of 9 mas diameter with a spot of 2 mas diameter on its surface representing 25% of the total flux. Fringe contrast Closure Phase UD UD+spot
Model vs Data (part II) 2.17 µm continuum 10 mas 2.38 µm CO-line
Resolved calibrator Unresolved calibrator Error on visibility solely due to uncertainty on the calibrator diameter The need for accurate determination of the calibrator diameters System response Calibrated visibility where
Dfcal/fcal= 1% Effects of diameter uncertainties on the visibility accuracy Dfcal/fcal= 3%
ASPRO The Astronomical Software to PRepare Observations
How to launch ASPRO in the web? http://www.jmmc.fr/aspro_page.htm
The interface – WHEN: to define the date and time of the simulated observation – WHERE: to select the interferometer (VLTI, IOTA, CHARA, …) and the number of telescopes – WHAT: to define the target properties (name, coordinates, brightness); – OBSERVABILITY/COVERAGE: to define the VLTI configuration to be used for the observations – MODEL/FIT: to calculate and plot interferometric observables and their associated uncertainties according to the chosen model (UD, LD, Binary, …) and the corresponding baseline configuration.
UT time delay line Night LST time Observability
V V V l=10µm l=10µm l=10µm Bp Bp Bp Model/Fit (part IV) [F1/F2]10µm=4 D I R E C T fext= 40mas fin = 20mas s = 40mas q =45° Æ = 30mas [F1/F2]10µm=1 Æ = 10mas Æ = 10mas F O U R I E R S P A C E
DEFINE THE BEST CALIBRATOR http://www.jmmc.fr/searchcal_page.htm How to launch SearchCal in the web?
Choose your observing wavelength (AMBER-H/K or MIDI-N) • The maximum baseline of your observation (limit of sensitivity) • The science target • The maximum location around the science target (close enough to avoid atmospheric biases) • And get your calibrators (from the various catalogs existing) CALIBRATORS
Separation from the science target in degree • Evaluation of the corresponding equivalent UD visibility value Table
location of the calibrator (as close as possible) • brightness (as bright as possible to get a high Signal to Noise ratio) • spectral type and luminosity (avoid complex object like cool stars) • visibility and accuracy (avoid too large objects -> V small -> poor S/N ratio) • variability (avoid to use variable objects that may lead to temporal biases in the calibrated measurements) • multiplicity (avoid multiple object that may lead to a wrong interpretation of the calibrated measurements) Selection criteria
DEFINE THE BEST CALIBRATOR HD35497