Download
1 / 27
270 likes | 419 Vues
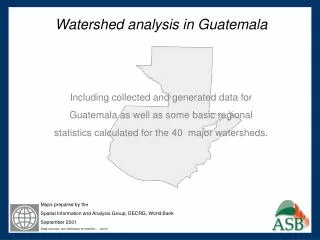
Watershed analysis in Guatemala Including collected and generated data for Guatemala as well as some basic regional statistics calculated for the 40 major watersheds. Maps prepared by the Spatial Information and Analysis Group, DECRG, World Bank September 2001

E N D
Watershed analysis in Guatemala Including collected and generated data for Guatemala as well as some basic regional statistics calculated for the 40 major watersheds. Maps prepared by the Spatial Information and Analysis Group, DECRG, World Bank September 2001 Data sources, too numerous to mention…..sorry!
Municipios Colours represent departments, municipal boundaries shaded in gray.
40 Major Watersheds Rio Paz Watershed
LandSat ETM images Rio Paz Watershed
Terrain Typology Plains - Greens Lowlands - Yellows Hills - Red Mountains - Grey High Mountains - White
Land Cover Forests - Green Agriculture - Light Yellow Water - Blue Other - Pink Urban - Red
Poverty Rate (General) Low - Green Medium - Yellow High - Orange Critical - Red
Poverty (General) Population per municipio classified as being poor
Poverty Rate (Extreme) Low - Green Medium - Yellow High - Orange Critical - Red
Poverty (Extreme) Population per municipio classified as being extremely poor
Forest / Agri. on Slopes Forests - Green Agriculture - Orange
Defining upper watershed areas 5 example methods 1) Use an elevation cut off across the region 2) Split each watershed into 3 based on elevation 3) Derive 3 terrain types (Meybeck) across the region 4) Use a flow length cut off across the region 5) Split each watershed into 3 based on flow length
1) Elevation - Region Low - Green Mid - Yellow High - Grey
2) Elevation - By shed Low - Green Mid - Yellow High - Grey
3) Terrain - Region Low - Green Mid - Yellow High - Grey
4) Flowlength - Region Low - Green Mid - Yellow High - Grey
5) Flowlength - By shed Low - Green Mid - Yellow High - Grey
% area in each region 70% 60% 50% Elev-Region 40% Elev-Shed Terrain-Region Flow-Region 30% Flow-Shed 20% 10% 0% Low Mid High Comparing the 5 examples How much land is in each region?
Population in each region 9,000,000 8,000,000 7,000,000 6,000,000 Elev-Region 5,000,000 Elev-Shed Terrain-Region 4,000,000 Flow-Region Flow-Shed 3,000,000 2,000,000 1,000,000 - Low Mid High Comparing the 5 examples How many people are in each region?
Poor (General) in each region 4,500,000 4,000,000 3,500,000 3,000,000 Elev-Region 2,500,000 Elev-Shed Terrain-Region 2,000,000 Flow-Region Flow-Shed 1,500,000 1,000,000 500,000 - Low Mid High Comparing the 5 examples How many poor are in each region?
km2 of forest per region 30,000 25,000 20,000 Elev-Region Elev-Shed 15,000 Terrain-Region Flow-Region Flow-Shed 10,000 5,000 - Low Mid High Comparing the 5 examples How much forest is in each region?
Defining upper watershed areas There is a lot of variation across the 5 methods methods 2 and 5 (that split each watershed into 3) consistently give high values in the high region, methods 1 and 4 consistently give low values in the high regions method 3 consistently gives values that lie in between Taking method 3 as an example….
Defining High / Mid / Low lands Using Method 3: Terrain Typologies (Meybeck et al. 2001) Class Area (km2) Agriculture (km2) Forest (km2) Low62,175 (57%) 30,668 (58%) 27,438 (57%) Mid16,958 (16%) 9,416 (18%) 5,830 (12%) High29,297 (27%) 12,698 (24%) 15,128 (31%) Total108,429 52,781 48,395 Class Population (2000) Poverty (General) Poverty (Extreme) Low2,498,093 (22%) 1,552,135 (25%) 542,990 (21%) Mid3,197,987 (28%) 1,187,251 (19%) 430,058 (17%) High5,694,926 (50%) 3,494,186 (56%) 1,621,909 (63%) Tot11,391,006 6,233,572 2,594,956 Population estimated for year 2000 per municipality, (MAGA / BID) Poverty rates per municipality from official Guatemala poverty map (SEGEPLAN / World Bank)
Selecting watersheds to analyse We could remove a certain number of watersheds by imposing criteria such as We are only interested in watersheds that have > 20% of there area classified as ‘high’. Taking method 3 as an example, this would remove all low lying watersheds
Selected Watersheds Selected watersheds shaded in yellow