Download
1 / 27
270 likes | 390 Vues
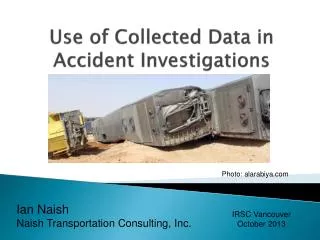
Use of Data Collected by the National Center for Statistics and Analysis. Tuesday, March 28, 2006 Presented by: Joseph S. Carra, Associate Administrator, NCSA. Examples. Nopus and Seatbelt Use Electronic Stability Control FARS and Geospatial Coding. Nopus and Seatbelt Use.

E N D
Use of Data Collected by the National Center for Statistics and Analysis Tuesday, March 28, 2006 Presented by: Joseph S. Carra, Associate Administrator, NCSA
Examples • Nopus and Seatbelt Use • Electronic Stability Control • FARS and Geospatial Coding
A Primary Use of Traffic Safety Data • One way that we use data is to: • determine a safety countermeasure, and • after implementation of the countermeasure, assess its effectiveness
An Example One of NHTSA’s priorities is to increase safety belt use.
Using Data to Identify a Countermeasure Historically, belt use has been lower than average in rural communities, and among pickup occupants:
Identify Countermeasure, Continued Safety Belt Use in 2004 Belt Use
Implementing the Countermeasure In 2005, NHTSA chose to focus its Click It or Ticket belt campaign on these two areas – rural areas and pickup occupants:
Analyzing Countermeasure Effectiveness The countermeasure was a success! STATISTICALLY SIGNIFICANT INCREASE STATISTICALLY SIGNIFICANT INCREASE Belt Use
Analyzing effectiveness of emerging technology and quickly disseminating results leads to appropriate market response.
How does ESC function? • Anticipates dangerous situations • Automatically intervenes • Brakes one wheel • Corrects over steer and under steer • Prevents skids, spins • Reduces situations leading to run-off-road and rollovers
Databases: ESC • FARS, 1997-2003 • NCSA State Data • Florida, 1997-2002 • Illinois, 1997-2002 • Maryland, 1997-2002 • Missouri, 1997-2002 • Utah, 1997-2002
Data Sample: ESC Passenger Cars • Mercedes-Benz and BMW models – 61 percent • Luxury GM models – 23 percent • Models from other manufacturers (Acura, Audi, Lexus, and VW) – 16 percent SUVs • Mercedes-Benz models (ML320, ML350, ML430, ML500, G500, G55 AMG) – 22 percent • Toyota models (4Runner, Land Cruiser) – 41 percent • Lexus models (RX300, LX470) – 37 percent
Analysis Method: ESC • Compute ratios of single vehicle crash involvements (excluding pedestrians, bicycles, animals) to multi-vehicle crash involvements (control group). • Compute percentage reductions in these ratios in vehicles with ESC vs. vehicles of the same make-models without ESC.
2004 ESC Effectiveness Results In the US, it is estimated that stability control could save 7,000 lives per year.
Resulting Actions • 2004-2006, research leading to rulemaking • In 2005, 20% of new vehicles had ESC as opposed to 10% in 2004. • General Motors has announced that by the year 2010, ESC will be standard equipment on all vehicles made.
The addition of new data element to an existing data system adds a whole new dimension to the use of the data systems.
What are crash rates for Congressional districts? FARS Congressional Districts Which School Districts have high fatal crash incidents? School Districts Air Medical Services Fly Zones Is there a significant relationship between survivorship and distance to EMS centers? Primary users of this system are traffic engineers…It is used to identify roadway, signage, design and or traffic signal problems. And, a countless number of other traffic safety questions...
US Census Dept Spatial Datahttp://www.census.gov/geo/www/cob/metadata.html Alaska Native Regional Corporations American Indian Areas/Alaska Native Areas/Hawaiian Home Lands Census Block Groups Census Divisions Census Regions Census Tracts Congressional Districts Consolidated Cities County and County Equivalent Areas County Subdivisions Incorporated Places/Census Designated Places Metropolitan and Micropolitan Statistical Areas New England County Metropolitan Area New England City and Town Areas Oregon Urban Growth Areas Public Use Microdata Areas School Districts – Elementary, Secondary, Unified State and State Equivalent Areas State Legislative Districts Traffic Analysis Zones Tribal Block Groups/Tribal Census Tracts Urban Areas Voting Districts ZIP Code Tabulation Areas
FARS GIS Reporting (*) Denotes active date entry.