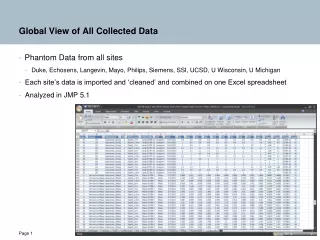
Download
1 / 24
240 likes | 412 Vues
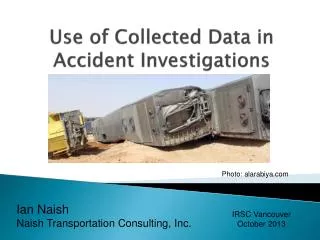
Use of Collected Data in Accident Investigations. Photo: alarabiya.com. Ian Naish Naish Transportation Consulting, Inc. IRSC Vancouver October 2013. This presentation describes. What is meant by “data” Why it is collected The various kinds of data collected The uses of the data

E N D
Use of Collected Data in Accident Investigations Photo: alarabiya.com Ian Naish Naish Transportation Consulting, Inc. IRSC Vancouver October 2013
This presentation describes • What is meant by “data” • Why it is collected • The various kinds of data collected • The uses of the data • Some examples and case studies • Conclusions and lessons learned
What is data? • factual information (as measurements or statistics) • information output by a sensing device • information in numerical form that can be digitally transmitted or processed Source: Merriam-Webster online Dictionary In investigations it is synonymous with evidence All of the above have to be analysed to be useful
Why Collect Data? • It is fundamental to the scientific method • To establish chain of events • To confirm investigative hypotheses • To determine accident causality • To identify safety deficiencies • To make recommendations to improve safety
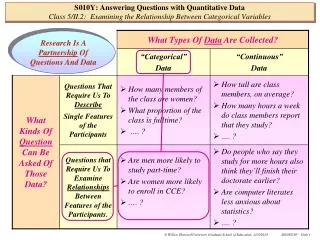
Some Types of Data • Operational • Technical • Environmental • Human factors • Organization • Perishable / non-perishable • Good data / bad data / limited data
Data Collected at Accident Site • Verbal information • Operational • Photographic • Site measurements • Environmental • Material (components, documentation) • Electronic (loco event recorder; digital video recordings) • Witness interviews and records Photos: TSB
Data Collected Off-site • Event recorder downloads • Railway company documentation • Materials examination – failure analysis • Historical accident, audit and inspection data • Police reports/Witness statements • Media records • Railway accident reports • N.B. Investigators have to have legal authority
What will the data be used for? Advancing transportation safety By (inter alia): • Establishing the chain of events • Confirming investigative hypotheses • Identifying systemic deficiencies • Identifying trends • Comparing performance • Identifying false information • Refuting incorrect statements • Assisting in legal issues (finding fault?)
When to Collect Data • Whenever a reportable accident occurs • Whenever an accident is investigated • Whenever a reportable incident occurs • Whenever safety regulations require it • Whenever investigators research an issue Photos: TSB
What to do with the Data Analyse it in order to make conclusions • Record it in a database • Review the data periodically for trend analysis • Analyse fields which relate to issues in a specific investigation • Formalize laboratory examinations in a report • Communicate to safety professionals, public & media • Discard any bad data when it is identified
Some Case Studies • Organizational data • Equipment (Derailment – Whitby, Ontario) • Perishable data (Level Crossing - Sarnia) • Limited data (Level Crossing – Al Kharj, Kingdom of Saudi Arabia) • Bad data (first 24 hours) and noisy communications records – Al Khurais, KSA
TSB Statistical Highlights 2012 Statistical highlights: railway occurrences • A total of 1,011 rail accidents under federal jurisdiction were reported to the TSB in 2012, similar to the 2011 total of 1,022 and a 10% decrease from the 2007-2011 average of 1,128. • Accidents involving dangerous goods totaled 118 in 2012, the same as in 2011 but down from the five-year average of 147. • In 2012, there were 48 accidents involving passenger trains, down from the 2011 total of 68 and down from the five-year….(contd) Source: TSB Canada
Rail Accidents Reported in 2004 Source: TSB Canada
Broken Rim (part of trend)between 1998 and 2004 Photos: waymarking.com and TSB Canada
Data from Media Video Photo: TSB
Incorrect Information and Communication Record Issues -Train 1 Derailment, KSA Source: pnninews.com.pk.
Derailment Site, looking northwest Source: constructionweek.com
Sand on Rail? Source: Saudi Gazette
Conclusions & Lessons Learned • Good data is a basic prerequisite for investigations analysis and to produce investigation reports • Data records allow trend monitoring • Investigation reports and statistical reports communicate safety issues • There are an increasing number of ways to obtain data • Data gaps must be identified and ways found to address them • Discard bad data whenever it is found!
Thank you! Photo: VIA Rail Canada