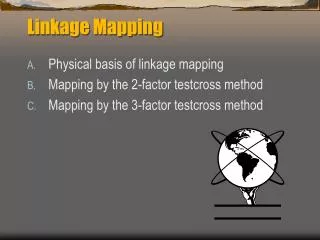
Joint Linkage and Linkage Disequilibrium Mapping
260 likes | 506 Vues
Joint Linkage and Linkage Disequilibrium Mapping. Key Reference Li, Q., and R. L. Wu, 2009 A multilocus model for constructing a linkage disequilibrium map in human populations. Statistical Applications in Genetics and Molecular Biology 8 (1): Article 18. Genetic Designs for Mapping.

Joint Linkage and Linkage Disequilibrium Mapping
E N D
Presentation Transcript
Joint Linkage and Linkage Disequilibrium Mapping Key Reference Li, Q., and R. L. Wu, 2009 A multilocus model for constructing a linkage disequilibrium map in human populations. Statistical Applications in Genetics and Molecular Biology 8 (1): Article 18.
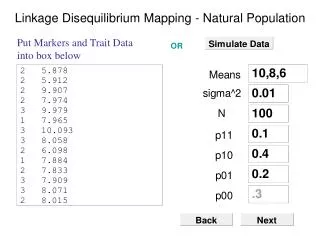
Genetic Designs for Mapping • Controlled crosses – Backcross, F2, full-sib family, … (linkage) • Unrelated (random) individuals from a natural population (linkage disequilibrium) • Cases and controls from a natural population • Unrelated (random) families from a natural population (linkage and LD) • Related (non-random) families from a natural population (linkage, LD and identical-by-descent) Family designs are increasingly used for genetic studies because of much information contained.
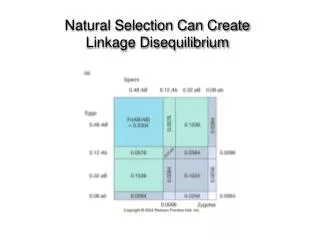
Natural Population • Consider two SNPs 1 (with two allele A and a) and 2 (with two alleles B and b) • The two SNPs are linked with recom. frac.r • The two SNPs form four haplotypes, AB, Ab, aB, and ab • Prob(A) = p, Prob(B) = q, linkage disequilibrium = D. We have haplotype frequencies as
Mating frequencies of families andoffspringgenotype frequencies per family
HWE assumed Can you figure out where this assumption is needed?
Segregation of double heterozygote • Overall haplotype frequencies produced by this parent are calculated as 1/2ω1 for AB or ab and 1/2ω2 for Ab or aB
A Joint Probability • Mother genotypes (Mm) • Father genotypes (Mf ) • Offspringgenotypes (Mo) P(Mm,Mf,Mo) = P(Mm,Mf)P(Mo|Mm.Mf) = P(Mm)P(Mf)P(Mo|Mm,Mf)
A joint two-stage log-likelihood Let unknown parameters
EM algorithm for Θ • E step • M step
EM algorithm for r • E step - calculate the probability with which a considered haplotype produced by a double heterozygote parent is the recombinant type using
E step (cont’d) • Calculate the probability with which a double heterozygote offspring carries recombinant haplotypesby
M step where m equals the sum of the following terms:
Hypothesis tests Linkage and Linkage disequilibrium H0: r = 0 and D = 0 H1: At least one equality does not hold LR = -2(log L0 – log L1) Critical threshold x2 (df=2)
Hypothesis tests Sex-specific difference in population structure
Hypothesis test • Sex-specific difference in the recombination fraction
Conclusions The model can jointly estimate the linkage and linkage disequilibrium between two markers - LD from parents - Linkage from offspring The model can draw a LD map to study the evolution of populations and high-resolution mapping of traits