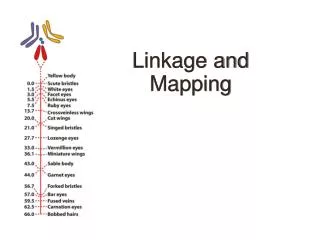
Linkage and Mapping
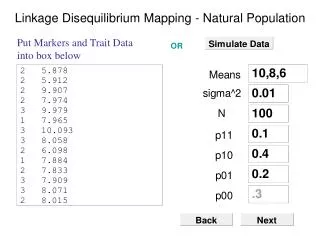
Linkage and Mapping. Phase I (2005) 1M SNPs from 269 individuals Phase II (2007) 3M SNPs from 270 individuals Phase III (2010) 1.6M SNPs genotyped from 1184 individuals from 11 populations Sequenced 10x 100kb regions from 692. Using haplotypes to deduce gene position. Figure 4-16.

Linkage and Mapping
E N D
Presentation Transcript
Phase I (2005) 1M SNPs from 269 individuals Phase II (2007) 3M SNPs from 270 individuals Phase III (2010) 1.6M SNPs genotyped from 1184 individuals from 11 populations Sequenced 10x 100kb regions from 692
Using haplotypes to deduce gene position Figure 4-16
Experimental Approach Subjects included 96 with AMD and 50 controls All white, not Hispanic Used Affymetrix GeneChip Mapping 100K set Two chips with 50K SNPs each Multiple independent expts run for each Statistical analysis of genotyping calls Statistical analysis of associations Sequencing of candidate gene in 66 patients and 30 controls
Sequencing CFH 50 polymorphisms, 17 with freq>5%, 3 non-synonymous one in exon 9 = Tyr His change
Quantitative Genetics • Continuous phenotypic variation within populations- not discrete characters • Phenotypic variation due to both genetic and environmental factors
Chapter 18 Opener Gaillardia pulchella
Figure 18-3b Quantitative traits are described by a frequency distribution
Why is quantitative genetics important? Medicine • Disease = variation • Complex disorders • caused by multiple genetic and environmental factors • Understanding genetic vs. environmental causes • prevention • genetic counselling • genetically-tailored treatments
Why is quantitative genetics important? Agriculture • Economically important traits = quantitative traits • Quantitative genetics theory -> basis for breeding programmes • Environmental variation reduces efficiency of selection
Why is quantitative genetics important? Evolution • Natural selection requires heritable variation for traits • What are the forces that maintain variation within populations? • Balance between selection, drift and mutation • Balancing selection?
Figure 18-2 Variation in quantitative traits increases in progeny
Figure 18-4 Phenotypic distributions sum to produce an overall distribution with a single mode
Figure 18-16 The distribution of a trait is composed of the distributions of the different genotypes
Figure 18-6 A norm of reaction is the relation between environment and phenotype
Figure 18-11 Crosses are performed to test for heritability
Genetic + environmental + interaction Heritability Measured using resemblance between relatives h2 = genetic variation phenotypic variation
Complex Traits • Most traits are complex • Multifactorial • Polygenic • Multigenic • QTL: quantitative trait locus • Region of a chromosome that contains a gene(s) with different alleles that contributes quantitatively to the variance in a trait