Download
1 / 33
330 likes | 446 Vues
Explore the principles of gene mapping, recombination frequencies, linkage groups, chromosome interference, and genetic polymorphisms in human pedigrees. Learn about RFLP analysis techniques and the significance of DNA mapping in identifying disease genes.

E N D
4 Gene Linkage and Genetic Mapping
If two genes are on different chromosomes… Half look like they got a set of the parents chromosomes… And half look like they got a mix of both parents chromosomes…
Now suppose both gene A and B were next to each other on the same chromosome. What happens to the ratios in this diagram?
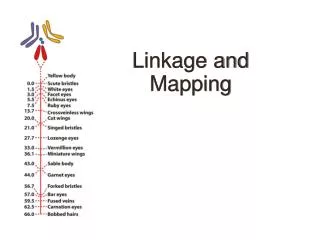
Gene Mapping • Gene mapping determines the order of genes and the relative distances between them in map units • 1 map unit= 1 cM (centimorgan) • Gene mapping methods use recombination frequencies between alleles in order to determine the relative distances between them • Recombination frequencies between genes are inversely proportional to their distance apart • Distance measurement: 1 map unit = 1 percent recombination (true for short distances)
Gene Mapping • Genes with recombination frequencies less than 50 percent are on the same chromosome = linked) • Linkage group = all known genes on a chromosome • Two genes that undergo independent assortment have recombination frequency of 50 percent and are located on nonhomologous chromosomes or far apart on the same chromosome = unlinked
Mapping the distance between two genes Starting with pure breeding lines, Cross Parent 1(AA BB) with Parent 2(aa bb) So Parental chromosomes in the F1 have to be AB and ab Now cross (AB ab) F1 progeny with (ab ab) tester to look for recombination on these chromosomes. Suppose you Get…… ABab 583 <parental abab 597 <parental Abab 134 <recombinant aBab 134 <recombinant total= 1448 so…. 268 recombinants /1448 progeny = 0.185 recombinants/progeny= 18.5% recombinants= 18.5 mu
Mapping (and ordering) three genes Starting with pure breeding lines, Cross Parent 1(AA BB DD) with Parent 2(aa bb dd) So you know the Parental chromosomes in the F1 have to be ABD and abc Cross (ABD abd) F1 progeny with (abd abd) tester Suppose you Get…… ABDabd 580 <parental ABd abd 3 abDabd 5 <parental abd abd 592 AbDabd 45 <recombinant Abd abd 89 aBDabd 94 aBd abd40 <recombinant total= 1448 Ab + aB = (45+89)+(94+40) recom 268 recom/1448 total =0.185 A-B =18.5mu Bd + bD = (3+40)+(5+45) 93 recom/1448 total= 0.064 B-D =6.4mu Ad + aD = (3+89)+(5+94) 191 recom/1448 total= 0.132 A-D =13.2mu so the order must be A-----D---B -13.2--6.4- ----18.5----
We missed the double recombinants on the first pass… (45+89)+(94+40)+2(3+5) recom 284recom/1448 total = 0.196 A-B =19.6mu longer the distance, more potential to underestimate recomb freq. So How come 13.2 + 6.4 does not equal 18.5? Cross (ABD abd) F1 progeny with (abd abd) tester Suppose you Get…… ABDabd 580 <parental ABd abd 3 abDabd 5 <parental abd abd 592 AbDabd 45 <recombinant Abd abd 89 aBDabd 94 aBd abd40 <recombinant total= 1448 Ab + aB = (45+89)+(94+40) recom 268 recom/1448 total =0.185 A-B =18.5mu A-----D---B -13.2--6.4- ----18.5----
Chromosome interference: crossovers in one region decrease the probability of a second crossover close by Coefficient of coincidence= observed number of double recombinants divided by the expected number \ Interference = 1-Coefficient of coincidence If the two crossovers were independent, we would expect that the probability of seeing two recombination events occur would be 0.132 between A-D AND 0.064 between D-B 0.132 X 0.064 = 0.008 For every 1448 progeny, this would be (1448x0.008)=12.23 double recombinants We actually observed only (5+3)= 8 double recombinants So the Coefficient of coincidence = observed / expected = 8/12.23 =0.65 Interference = 1-Coefficient of coincidence = 1- 0.65 = 0.35
Mapping Genes in Human Pedigrees • Methods of recombinant DNA technology are used to map human chromosomes and locate genes • Genes can then be cloned to determine structure and function • Human pedigrees and DNA mapping are used to identify dominant and recessive disease genes • PolymorphicDNA sequences are used in human genetic mapping.
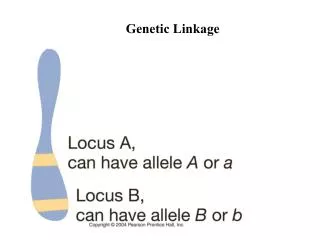
Genetic Polymorphisms • The presence in a population of two or more relatively common forms of a gene or a chromosome is called polymorphism • Changes in DNA fragment length produced by presence or absence of the cleavage sites in DNA molecules are known as restriction fragment length polymorphism (RFLP) • A prevalent type of polymorphism is a single base pair difference, simple-nucleotide polymorphism (SNP) • A genetic polymorphism resulting from a tandemly repeated short DNA sequence is called a simple sequence repeat (SSR)
RFLPs • Restriction endonucleases are used to map genes as they produce a unique set of fragments for a gene • There are more than 200 restriction endonucleases in use, and each recognizes a specific sequence of DNA bases • EcoR1cuts double-stranded DNA at the sequence 5’-GAATTC-3’ wherever it occurs
RFLPs • Differences in DNA sequence generate different recognition sequences and DNA cleavage sites for specific restriction enzymes • Two different genes will produce different fragment patterns when cut with the same restriction enzyme due to differences in DNA sequence Fig. 4.19
SNPs • Single-nucleotide polymorphisms (SNPs) are abundant in the human genome • Rare mutants of virtually every nucleotide can probably be found, but rare variants are not generally useful for family studies of heritable variation in susceptibility to disease • For this reason, in order for a difference in nucleotide sequence to be considered as an SNP, the less-frequent base must have a frequency of greater than about 5% in the human population. • By this definition, the density of SNPs in the human genome averages about one per 1300 bp
SSRs • A third type of DNA polymorphism results from differences in the number of copies of a short DNA sequence that may be repeated many times in tandem at a particular site in a chromosome • When a DNA molecule is cleaved with a restriction endonuclease that cleaves at sites flanking the tandem repeat, the size of the DNA fragment produced is determined by the number of repeats present in the molecule • There is an average of one SSR per 2 kb of human DNA
Mapping Genes in Human Pedigrees • One source of the utility of SNPs and SSRs in human genetic mapping is their high density across the genome • Additional source of utility of SSRs in genetic mapping is the large number of alleles that can be present in any human population.
Mapping Genes in Human Pedigrees • Human pedigrees can be analyzed for the inheritance pattern of different alleles of a gene based on differences in SSRs and SNPs • Restriction enzyme cleavage of polymorphic alleles that are different in RFLP pattern produces different size fragments by gel electrophoresis
What’s the probability that II1 is a carrier of the disease? 100% DD dd Dd A rare recessive disease that affects people late in life is 90% linked to the RFLP marker on the gel below. What’s the probability that the grandchildren (row III) are carriers? 90% 10% 90%10% 10% 90% 90%
What’s the probability that II1 is a carrier of the disease? 100% DD dd Dd A rare recessive disease that affects people late in life is 90% linked to the RFLP marker on the gel below. What’s the probability that the grandchildren (row III) are carriers? 10% 90% 10% 90% 90% 10% 10%
Tetrad Analysis • In some species of fungi, each meiotic tetrad is contained in a sac-like structure, called an ascus • Each product of meiosis is an ascospore, and all of the ascospores formed from one meiotic cell remain together in the ascus • Several features of ascus-producing organisms are especially useful for genetic analysis: • They are haploid, so the genotype is expressed directly in the phenotype • They produce very large numbers of progeny • Their life cycles tend to be short
Tetrad Analysis • In tetrads when two pairs of alleles are segregating, three patterns of segregation are possible • parental ditype (PD) = two parental genotypes • nonparental ditype (NPD) = only recombinant combinations • tetratype (TT) = all four genotypes observed
Tetrad Analysis • When genes are unlinked, the parental ditype tetrads and the nonparental ditype tetrads are expected in equal frequencies: PD = NPD • Linkage is indicated when nonparental ditype tetrads appear with a much lower frequency than parental ditype tetrads: PD » NPD • Map distance between two genes that are sufficiently close that double and higher levels of crossing-over can be neglected, equals 1/2 x (Number TT / Total number of tetrads) x 100
Neurospora: Ordered Tetrads • Ordered asci also can be classified as PD, NPD, or TT with respect to two pairs of alleles, which makes it possible to assess the degree of linkage between the genes • The fact that the arrangement of meiotic products is ordered also makes it possible to determine the recombination frequency between any particular gene and its centromere
Tetrad Analysis: Ordered Tetrads • Homologous centromeres of parental chromosomes separate at the first meiotic division • The centromeres of sister chromatids separate at the second meiotic division • When there is no crossover between the gene and centromere, the alleles segregate in meiosis I • A crossover between the gene and the centromere delays segregation alleles until meiosis II
The map distance between the gene and its centromere equals • 1/2 x (Number of asci with second division segregation/ Total number of asci) x 100 • This formula is valid when the gene is close enough to the centromere and there are no multiple crossovers
Gene Conversion • Most asci from heterozygous Aa diploids demonstrate normal Mendelian segregation and contain ratios of 2A : 2a in four-spored asci, or 4A : 4a in eight-spored asci Occasionally, aberrant ratios are also found, such as 3A : 1a or 1A : 3a and 5A : 3a or 3A : 5a. The aberrant asci are said to result from gene conversion because it appears as if one allele has “converted” the other allele into a form like itself • Gene conversion is frequently accompanied by recombination between genetic markers on either side of the conversion event, even when the flanking markers are tightly linked • Gene conversion results from a normal DNA repair process in the cell known as mismatch repair • Gene conversion suggests a molecular mechanism of recombination
One of two ways to resolve the resulting structure, known as a Holliday junction, leads to recombination, the other does not • The breakage and rejoining is an enzymatic function carried out by an enzyme called the Holliday junction-resolving enzyme