Download
1 / 9
90 likes | 234 Vues
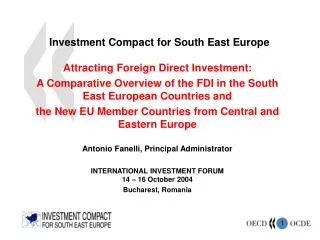
Investment Compact for South East Europe. Attracting Foreign Direct Investment: A Comparative Overview of the FDI in the South East European Countries and the New EU Member Countries from Central and Eastern Europe Antonio Fanelli, Principal Administrator

E N D
Investment Compact for South East Europe Attracting Foreign Direct Investment: A Comparative Overview of the FDI in the South East European Countries and the New EU Member Countries from Central and Eastern Europe Antonio Fanelli, Principal Administrator INTERNATIONAL INVESTMENT FORUM14 – 16 October 2004 Bucharest, Romania
FDI Inflows in the South East European Countries in US$ million Countries 1999 2000 2001 2002 2003* Projections 2004 Albania 41 143 200 135 178 300 BiH 90 150 130 321 381 350 Bulgaria 819 1,002 689 874 1,419 1,500 Croatia 1,637 1,126 1,502 1,124 1,956 1,058 Macedonia 32 176 442 78 95 133 Moldova 40 143 149 116 58 120 Romania 1,041 1,040 1,373 1,097 1,562 2,000 Serbia and Montenegro 112 25 165 592 1,305 1,000 Totals 3,812 3,805 4,650 4,337 6,954 6,461 Source: Monitoring Instruments, April 2004 * Foreign Direct Investment In South East Europe in 2003 – 2004, WIIW, 2004
Absolute Level of Inward FDI Stock (current US$ million) Source: Monitoring Instruments, April 2004; CEE4: Czech Republic, Hungary, Poland and Slovak Republic
Gross Domestic Product (GDP) and GDP per capita at current prices and market exchange rates GDP (US$ Billions)GDP per capita (US$) (Weighted averages) 1990 (*) 1994 1998 2003 1990 (*) 1994 1998 2003 CEE4142 190 284 405 2,219 2,947 4,403 6,281 SEE8 166 78 104 138 2,720 1,311 1,781 2,520 Bulgaria + Croatia + Romania 121 54 76 105 3,297 1,518 2,163 3,081 Rest of SEE 46 24 28 33 1,857 998 1,204 1,605 (*) Excluding Bosnia and Herzegovina in 1990, where GDP data are not available for that year. Source: Monitoring Instruments, April 2004
FDI Stock Per Capita in SEE and CEE Countries: 1888 vs. 2003 (in current US$) Source: Monitoring Instruments, April 2004
Inward FDI Stock as a percentage of GDP Source: Monitoring Instruments, April 2004
Export Growth Source: Monitoring Instruments, April 2004
FDI vs. Export Performance Source: Monitoring Instruments, April 2004
For more information: Antonio.Fanelli@oecd.org www.InvestmentCompact.org Thank You!