Download

1 / 59
730 likes | 2.36k Vues
Central Composite Design. WWW.PARASSHAH.WEEBLY.COM. Definition of Experimental Design. It is the methodology of how to conduct and plan experiments in order to extract the maximum amount of information in the fewest number of runs. Cost approach. Change one separate factor at a time (COST)

E N D
Central Composite Design WWW.PARASSHAH.WEEBLY.COM
Definition of Experimental Design It is the methodology of how to conduct and plan experiments in order to extract the maximum amount of information in the fewest number of runs.
Cost approach • Change one separate factor at a time (COST) • PROBLEMS WITH COST: • Does not lead to real optimum • Inefficient, unnecessarily many runs • Provides no information about what happens when factors are varied simultaneously (ignores interaction) • Provides less information about the variability of the responses
Good Experimental Design Should help us in following: Show real effect Reduce noise Should provide efficient mapping of functional space Reduce time and cost
Stages in Experimental Design Process Familiarization Formulate Question(s) stating the objectives and Goals of the Investigation. 2) Screening Screening designs provide simple models with information about dominating variables, and information about ranges. In addition they provide few experiments/ factors which means that relevant information is gained in only a few experiments. 3) Finding optimal region of operability 4) Response surface modeling and optimization
Types of Experimental Design • Choice of experiments depends on level of knowledge before experiments, resource available and objectives of the experiments • Discovering important process factors • Placket-Burman • Fractional Factorial • Estimating the effect and interaction of several factors • Full Fractional • Fractional Factorial • Tiguchi • For optimization • Central composite • Simplex lattice • D-optimal • Box Behnken
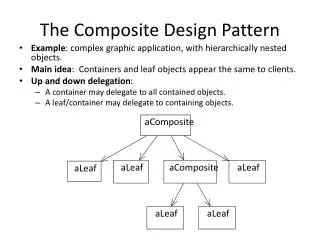
Central Composite Design A Box-Wilson Central Composite Design, commonly called `a central composite design,' contains an imbedded factorial or fractional factorial design with center points that is enlarged with a group of `star points' that allow estimation of curvature.
Implementation of design The design consists of three distinct sets of experimental runs: A factorial(perhaps fractional) design in the factors studied, each having two levels; A set of center points, experimental runs whose values of each factor are the medians of the values used in the factorial portion. A set of axial points (star point), experimental runs identical to the centre points except for one factor, which will take on values both below and above the median of the two factorial levels, and typically both outside their range.
Design matrix The design matrix for a central composite design experiment involving k factors is derived from a matrix, d, containing the following three different parts corresponding to the three types of experimental runs: The matrix F obtained from the factorial experiment. The factor levels are scaled so that its entries are coded as +1 and −1. The matrix C from the center points, denoted in coded variables as (0,0,0,...,0), where there are k zeros. A matrix E from the axial points, with 2k rows. Each factor is sequentially placed at ±α and all other factors are at zero.
Comparison of 3 Central composite design CCC explores the largest process space and the CCI explores the smallest process space. Both the CCC and CCI are rotatabledesigns, but the CCF is not. Both the CCC and CCI are require 5 level for each factor while CCF is require 3 level for each factor.
Generation of a Central Composite Design for Two Factor A central composite design always contains twice as many star points as there are factors in the design. The star points represent new extreme values (low and high) for each factor in the design ±α.
Determining α in central Composite Design To maintain rotatability, the value of α depends on the number of experimental runs in the factorial portion of the central composite design If the factorial is a full factorial, then If the factorial is a fractional factorial, then
Table below show how to choose value of α and of center point for CCD Where K: number of factor nf: experiments in factorial design ne: experiments in star design
Box-Behnkendesigns The Box-Behnken design is an independent quadratic design in that it does not contain an surrounded factorial or fractional factorial design. In this design the treatment combinations are at the midpoints of edges of the process space and at the center. These designs are rotatable (or near rotatable) and require 3 levels of each factor.
Box-Behnken designs are response surface designs, specially made to require only 3 levels, coded as -1, 0, and +1. Box-Behnken designs are available for 3 to 10 factors. It is formed by combining two-level factorial designs with incomplete block designs. This procedure creates designs with desirable statistical properties but, most importantly, with only a fraction of the experimental trials required for a three-level factorial. Because there are only three levels, the quadratic model was found to be appropriate. In this design three factors were evaluated, each at three levels, and experiment design were carried out at all seventeen possible combinations.
Number of Runs Required by Central Composite and Box-Behnken Designs
Case study of Box Behnken Experimental Design
Coded and actual values of Box-Behnken design The amount of HPMC K4M (X1), amount of Carbopol 934P (X2) and amount of Sodium alginate (X3) were selected as independent variables.
Multiple Regression • It is an extension of linear regression in which we wish to relate a response, Y dependent variables to more than one independent variable • Linear Regression • Y = A+ BY • Multiple Regression • Y = bo + b1X1 + b2X2+…. • X1, X2, …. Represent factors which influence the response
Y = bo + b1X1 + b2X2 + b3X3… • Y is response i.e. dissolution time • Xi is independent variable • bo is the intercept • bi is regression coefficient for the ith independent variable • X1, X2, X3.. Are the levels of variables
The Polynomial equation generated by this experimental design is described as: Yi = b0 + b1x1 +b2x2 + b3x3 + b12x1x2 + b13 x1x3 + b23x2x3 + b11x12 +b22x22 + b33x32 Where Yi is the dependent variable b0 is the intercept; bi, bij and bijk represents the regression coefficients Xi represents the level of independent variables which were selected from the preliminary experiments.
Correlation Coefficient • When two variables are correlated with each other it is important to know the amount or extent of correlation between them, r = 1 Present direct or positive correlation r = -1 Present inverse or negative correlation r = 0 No linear correlation/ absence r = + 0.9 / + 0.8 High degree of relationship r = + 0.2 or 0.1 Low high degree of relationship
R-Square = 0.5996 R- Square = 0.898329 R –Square = 0.928214 R-Square = 0.845881
ANOVA or Analysis of Variance • Analysis of variance technique developed by R A Fisher, to compare two or more groups means. • Analysis of variance (ANOVA) is used to find out the main and interaction effects of categorical independent variables (called "factors") on an interval dependent variable.
Steps in Computation of ANOVA 1.Find SST: (Total sum of squares) 2. Find SSB: (between sum of squares) 3. Find SSW by subtraction: (within sum of squares) Correction factor
4. Calculate the degrees of freedom: dfb = k-1 and dfw = N – k. (N is total number of observations, k – number of methods to be compared) 5. Construct the mean square (MS) estimates by dividing SSB and SSW by their degrees of freedom: MSw= SSW / dfw MSb= SSB / dfb 6. Find F ratio by Formula: F = MSb/ MSw
One-Way ANOVA • It is also known as Completely Randomized Design (CRD). • We can take two independent groups ‘t’ test to analyze in ANOVA. • Ex: Two treatment are randomly assigned to different patients. The results in two groups, each group representing one of the two treatments.
Source SS DF MS F calculated F tabulated Treatments 244.14 02 122.07 8.68 Errors 168.80 12 14.07 Total 412.94 14 Analysis of Variance table Conclusion: If, F calculated > F Tabulated, then the Null hypothesis is rejected and if F calculated < F tabulated, then we accept the Null hypothesis.
One Way analysis of variance – Example 1 Degree of Freedom (df) = N - 1 = 15 – 1 = 14 Between treatment df = k - 1 = 3-1 = 2 Within treatment df = N - k = 15 – 3 = 12 Ti – sum of observations in treatment groups Ni – number of observations in treatment group
One Way analysis of variance – Example 1 (cont.) Ftabulated = 3.89 Fcalculated < Ftabulated All means are equal. Therefore, Method A = Method B = Method C
One Way analysis of variance – Example 2 Ftabulated = 8.02 Fcalculated > Ftabulated (19.41 > 8.02) Shows significant difference in results.
Two Way ANOVA • In two way ANOVA, one can test sets of hypothesis with the same data at the same time. • SST = SSR + SSC + SSE SST – Total sum of square SSR – Sum of square due to rows SSC – Sum of square due to column SSE – sum of square due to error.
Two Way ANOVA - Example • The determination of maximum plasma concentration of drug in mcg/ml for 3 different formulation A, B & C, was the subject of a recent experiment. Four different subjects chosen at random for a group were used for this purpose.
Two Way ANOVA - Example • Carry out two way ANOVA for • There is no significant difference between subjects and • There is no significance difference between maximum plasma concentration of different formulations
Two Way ANOVA - Example F(3,6) tablated = 4.76 Fcalculated < Ftabulated Therefore H0isaccepted at 5% level, no difference between subjects Fcalculated > Ftabulated 15.37 > 5.14 H0 is rejected at 5% level of significance. Hence, there is significance difference between maximum plasma concentration of different formulations.
ANOVA - Overview • Analysis of variance tests the null hypothesesthat group means do not differ. It is not a test of differences in variances, but rather assumes relative homogeneity of variances. Thus some key ANOVA assumptions are that the groups formed by the independent variables are relatively equal in size and have similar variances on the dependent variable ("homogeneity of variances"). • Like regression, ANOVA is a parametric procedure which assumes multivariate normality (the dependent has a normal distribution for each value category of the independents).
ANOVA - Overview • The key statistic in ANOVA is the F-test of difference of group means, testing if the means of the groups formed by values of the independent variable are different enough not to have occurred. • If the group means do not differ significantly then it is inferred that the independent variables did not have an effect on the dependent variable.
Key Concepts • ANOVA can be used in situations where the researcher is interested in the differences in sample means across three or more categories. GBSHAH KBIPER
Key Concepts (cont.) • Examples: • Reduction in pain/BP by various drugs • Percent distribution after 15 min for tablets for a single batch tested in 5 laboratories • Comparison of dissolution of various tablet formulations • Replicate tablet dissolution for number of Laboratories • Change in BP during pre-clinical study comparing 2 drugs and control • Increase in exercise time for 3 treatments of anti-histaminics at three clinical sites • HB level of no. of groups of children fed by 3 different diets • Performance of 3 salesman
Contour Plot A contour plot is a graphical technique for representing a 3-dimensional surface by plotting constant z slices, called contours, on a 2-dimensional format. That is, given a value for z, lines are drawn for connecting the (x, y) coordinates where that z value occurs.