Download
1 / 10
100 likes | 117 Vues
Phenyl imidazole propionate derivative which shows wide range of biological activities was synthesized. The yield of imidazole ring formation<br>i.e. conversion of 1-isopropyl 3-(2-oxo-2-phenylethyl)2-(4-methoxybenzyl)malonate (1) to tert-butyl 3-(4-methoxyphenyl)-2-(4-phenyl-1Himidazole-2-yl)propanoate (2) was improved from 35% to 87%. Statistical model based screening and optimization DOE study were carried out<br>to derive the most favorable design space and optimal operating condition for the process parameters. The model of optimization study was<br>created using central composite design. Model-validation was performed which showed excellent reproducibility with high degree of precession.<br>Use of ammonium chloride as a catalyst to improve the yield of imidazole ring formation reaction was also explored for the first time

E N D
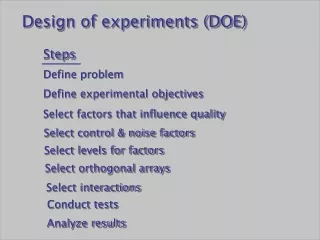
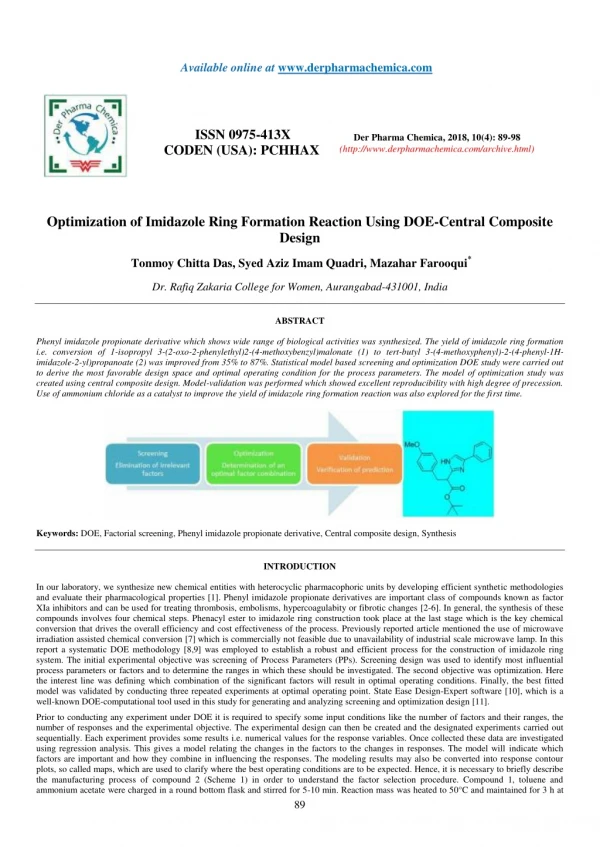
Available online at www.derpharmachemica.com ISSN 0975-413X CODEN (USA): PCHHAX Der Pharma Chemica, 2018, 10(4): 89-98 (http://www.derpharmachemica.com/archive.html) Optimization of Imidazole Ring Formation Reaction Using DOE-Central Composite Design Tonmoy Chitta Das, Syed Aziz Imam Quadri, Mazahar Farooqui* Dr. Rafiq Zakaria College for Women, Aurangabad-431001, India ABSTRACT Phenyl imidazole propionate derivative which shows wide range of biological activities was synthesized. The yield of imidazole ring formation i.e. conversion of 1-isopropyl 3-(2-oxo-2-phenylethyl)2-(4-methoxybenzyl)malonate (1) to tert-butyl 3-(4-methoxyphenyl)-2-(4-phenyl-1H- imidazole-2-yl)propanoate (2) was improved from 35% to 87%. Statistical model based screening and optimization DOE study were carried out to derive the most favorable design space and optimal operating condition for the process parameters. The model of optimization study was created using central composite design. Model-validation was performed which showed excellent reproducibility with high degree of precession. Use of ammonium chloride as a catalyst to improve the yield of imidazole ring formation reaction was also explored for the first time. Keywords: DOE, Factorial screening, Phenyl imidazole propionate derivative, Central composite design, Synthesis INTRODUCTION In our laboratory, we synthesize new chemical entities with heterocyclic pharmacophoric units by developing efficient synthetic methodologies and evaluate their pharmacological properties [1]. Phenyl imidazole propionate derivatives are important class of compounds known as factor XIa inhibitors and can be used for treating thrombosis, embolisms, hypercoagulabity or fibrotic changes [2-6]. In general, the synthesis of these compounds involves four chemical steps. Phenacyl ester to imidazole ring construction took place at the last stage which is the key chemical conversion that drives the overall efficiency and cost effectiveness of the process. Previously reported article mentioned the use of microwave irradiation assisted chemical conversion [7]which is commercially not feasible due to unavailability of industrial scale microwave lamp. In this report a systematic DOE methodology [8,9] was employed to establish a robust and efficient process for the construction of imidazole ring system. The initial experimental objective was screening of Process Parameters (PPs). Screening design was used to identify most influential process parameters or factors and to determine the ranges in which these should be investigated. The second objective was optimization. Here the interest line was defining which combination of the significant factors will result in optimal operating conditions. Finally, the best fitted model was validated by conducting three repeated experiments at optimal operating point. State Ease Design-Expert software [10], which is a well-known DOE-computational tool used in this study for generating and analyzing screening and optimization design [11]. Prior to conducting any experiment under DOE it is required to specify some input conditions like the number of factors and their ranges, the number of responses and the experimental objective. The experimental design can then be created and the designated experiments carried out sequentially. Each experiment provides some results i.e. numerical values for the response variables. Once collected these data are investigated using regression analysis. This gives a model relating the changes in the factors to the changes in responses. The model will indicate which factors are important and how they combine in influencing the responses. The modeling results may also be converted into response contour plots, so called maps, which are used to clarify where the best operating conditions are to be expected. Hence, it is necessary to briefly describe the manufacturing process of compound 2 (Scheme 1) in order to understand the factor selection procedure. Compound 1, toluene and ammonium acetate were charged in a round bottom flask and stirred for 5-10 min. Reaction mass was heated to 50°C and maintained for 3 h at 89
Der Pharma Chemica, 2018, 10(4): 89-98 Tonmoy Chitta Das et al. the same temperature. After completion of reaction the mass was cooled to room temperature. Reaction mass quenched with saturated NaHCO3 solution. Toluene layer separated and concentrated. Initial few experiments showed low yield (~35%). Sequential experimental designs, i.e. initially screening followed by optimization study were carried out to explore the reaction space more efficiently than one factor at a time approach. Scheme 1: Preparation of substituted alkyl-3-methoxyphenyl-2-(4-phenylimidazol-2-yl) propionate (2) derivative MATERIALS AND METHODS All the key starting materials, solvents and reagents were obtained from Sigma Aldrich and Merck Specialties Pvt. Ltd. DOE software “State Ease-Design Expert Version 10.0” is used as a statistical tool. Based on initial few experiments, prior subject knowledge and Failure Mode Effect Analysis (FMEA) analysis, four Process Parameters (PPs) i.e. mole equivalent of ammonium acetate, quantity of toluene, reaction temperature and reaction time were identified as the process parameters (CPPs) and chosen for screening to understand which factor is significant for the chosen response (i.e. yield) of the chemical conversion. Regular two level fraction factorial (resolution IV) design has been chosen with three centre points. Adequately wide ranges for the factors were chosen for the study. The ranges of factors (i.e. high and low values) are given in the Table 1. The rationale behind the ranges of tested factors was that they should be sufficiently wide in order to get a clear picture of how these factors influence the yield. The center points serve to determine the signal to noise ratio and can show whether curvature occurs in a linear model. Table 1: Ranges chosen for factors in optimization study (fraction factorial) Factor Name Unit A Ammonium acetate mmol B Reaction temperature °C C Quantity of toluene Volume (V) D Reaction time Hour (h) Screening DOE The software created an experimental plan applying the 24-1 fraction factorial design. Eleven experiments were carried out following the conditions as per the design. The experimental conditions and their outcome responses are captured in Table 2. Table 2: Details of experimental conditions obtained using the 24-1 fraction factorial design & their corresponding response values Std Run Factor A Factor B 11 1 5 80 1 2 2 50 5 3 2 50 4 4 8 110 3 5 2 110 8 6 8 110 7 7 2 110 2 8 8 50 9 9 5 80 10 10 5 80 6 11 8 50 Response range was from 48 to 82 and the ratio of maximum to minimum was 1.70. Since the ratio was less than 3, power transformation was not required during effects and ANOVA analysis. The result of this study can be visualized in half normal plot and (Figure 1) and pareto chart (Figure 2). In case of half normal plot factors having statistically significant effect stay away from the indicator (red) line. On the Pareto chart, bars that cross the reference line are statistically significant. It was evident from both the plot that, most significant factors which influence the yield are amount of ammonium acetate and reaction temperature. The reaction time and amount of solvent had no significant effect on yield. Low 2 50 3 1 High 8 110 15 10 Factor C 9 3 15 3 3 15 15 3 9 9 15 Factor D 5.5 1 10 1 10 10 1 10 5.5 5.5 1 Response yield 73 48 50 70 62 82 60 73 75 74 71 90
Der Pharma Chemica, 2018, 10(4): 89-98 Tonmoy Chitta Das et al. Design-Expert® Software Yield Half-Normal Plot Error estimates A: Amm Ac B: Rxn Temp C: Toluene Qnt D: Rxn Time Positive Effects Negative Effects 95 A-Amm Ac 90 Half-Normal % Probability B-Rxn Temp 80 D-Rxn Time 70 AB 50 C-Toluene Qnt 30 AC 20 10 0 0.00 3.80 7.60 11.40 15.20 19.00 |Standardized Effect| Figure 1: Half normal plot: absolute values of effect estimates Pareto Chart A-Ammonium Acetate 7.98 5.99 t-Value of |Effect| Bonf erroni Limit 5.06751 3.99 B-Reaction Temparature t-Value Limit 2.77645 D-Reaction Time 2.00 AC C-Quantity of Toluene AD 0.00 1 2 3 4 5 6 7 Rank Figure 2: Parito chart: to understand the biggest contributor impacting the response Table 3: ANOVA for selected factorial model Sum of Source Squares df* Model 928 6 A-Ammonium acetate 722 B-Reaction temperature 128 C-Quantity of toluene 12.5 D-Reaction time 40.5 AC 12.5 AD 12.5 Curvature 196.91 Residual 34 Lack of Fit 32 *df=Degree of freedom, **Prob=Probability Mean Square 154.67 722 128 12.5 40.5 12.5 12.5 196.91 11.33 32 F p-value Prob **>F 0.0279 0.0041 0.0437 0.3708 0.1551 0.3708 0.3708 0.0251 0.0299 Value 13.65 63.71 11.29 1.1 3.57 1.1 1.1 17.37 Significant Significant 1 1 1 1 1 1 1 3 1 32 The most significant factors which are responsible for considerable variation of response can also be identified from ANOVA analysis of the model. The Model F-value of 2.68 implies the model was not significant relative to the noise (Table 3). There is a 17.96% chance that F-value this large could occur due to noise. Values of "Prob > F" less than 0.0500 indicates model terms are significant. In this case, "Prob > F" value for quantity of ammonium acetate (A) was 0.0041, indicated it as the most significant model term. Second largest factor in terms of significance was the reaction temperature with the value of 0.0437. Values greater than 0.1000 indicate the model terms are not significant. The "Lack of Fit F- value" of 114.45 implies the "Lack of Fit" was also significant. There was only a 0.87% chance that a "Lack of Fit F-value" this large could occur due to noise. Significant lack of fit was not desirable. This was a clear indication that the linear assumption made in the factorial model was not descriptive for real response surface. The model derived from this screening study can only provide a rough indication of point prediction within the chosen boundary. The 3D surface plot showed sharp and steady increase in yield from 52% to 79% with the increase in both ammonium acetate quantity and reaction temperature (Figure 3) which was significant. To understand the effect of reaction time, two 3D 91
Der Pharma Chemica, 2018, 10(4): 89-98 Tonmoy Chitta Das et al. surface plots (Figures 4 and 5) were derived at lowest (1 h) and highest (10 h) points of time interval, keeping the toluene quantity constant at 9 volume. Prediction showed that, increase in yield from 73% to maximum 79% possible with the increase in time which was insignificant. Further to understand the significance of toluene quantity, another two 3D surface plots (Figures 6 and 7) were derived at lowest (3 volume) and highest (15 volumes) points of toluene range, keeping the reaction time constant at 5.5 h. Prediction showed that ~5% (i.e.74% to 79%) increase in yield is possible with steady increase in toluene volume which was also negligible. The target of our screening study was achieved; quantities of ammonium acetate and reaction temperature were identified as the most significant factors for subsequent DOE-optimization study. Design-Expert® Software Factor Coding: Actual Yield (%) Design points above predicted value 82 48 100 X1 = A: Ammonium Acetate X2 = B: Reaction Temparature 90 Actual Factors C: Quantity of Toluene = 9 D: Reaction Time = 5.5 80 70 Yield (%) 60 50 40 30 110 8 100 7 90 6 80 5 70 4 B: Reaction Temp (°C) A: Amm Acetate (mmol) 60 3 50 2 Figure 3: 3D surface plot of yield when reaction time was 5.5 h and toluene quantity 9 volumes Design-Expert® Software Factor Coding: Actual Yield (%) 82 48 X1 = A: Ammonium Acetate X2 = B: Reaction Temparature 100 90 Actual Factors C: Quantity of Toluene = 9 D: Reaction Time = 1 80 70 Yield (%) 60 50 40 30 110 8 100 7 90 6 80 5 70 4 B: Reaction Temp (°C) A: Amm Acetate (mmol) 60 3 50 2 Figure 4: 3D surface plot of yield when reaction time is 1 h and toluene quantity 9 volumes 92
Der Pharma Chemica, 2018, 10(4): 89-98 Tonmoy Chitta Das et al. Design-Expert® Software Factor Coding: Actual Yield (%) 82 48 X1 = A: Ammonium Acetate X2 = B: Reaction Temparature 100 90 Actual Factors C: Quantity of Toluene = 9 D: Reaction Time = 10 80 70 Yield (%) 60 50 40 30 110 8 100 7 90 6 80 5 70 4 B: Reaction Temp (°C) A: Amm Acetate (mmol) 60 3 50 2 Figure 5: 3D surface plot of yield when reaction time is 10 h and toluene quantity 9 volumes Design-Expert® Software Factor Coding: Actual Yield (%) 82 48 X1 = A: Ammonium Acetate X2 = B: Reaction Temparature 100 90 Actual Factors C: Quantity of Toluene = 3 D: Reaction Time = 5.5 80 70 Yield (%) 60 50 40 30 110 8 100 7 90 6 80 5 70 4 B: Reaction Temp (°C) A: Amm Acetate (mmol) 60 3 50 2 Figure 6: 3D surface plot of yield when toluene quantity is 3 volumes and reaction time 5.5 h Design-Expert® Software Factor Coding: Actual Yield (%) 82 48 X1 = A: Amm Ac X2 = B: Rxn Temp 90 Actual Factors C: Toluene Qnt = 15 D: Rxn Time = 5.5 80 70 Yield (%) 60 50 40 110 8 100 7 90 6 80 5 A: Amm Ac (mol) 70 4 B: Rxn Temp (degC) 60 3 50 2 Figure 7: 3D surface plot of yield when toluene quantity is 15 volumes and reaction time 5.5 h 93
Der Pharma Chemica, 2018, 10(4): 89-98 Tonmoy Chitta Das et al. Optimization DOE The objective of optimization DOE was to obtain maximum yield by defining optimal operating region. Based on screening DOE, out of four PPs only two PPs i.e. mmol of ammonium acetate and reaction temperature were identified as the CPPs. These two CPPs were considered as input factors for optimization DOE. In order to reduce the variability of the process most sensitive regions i.e. the corner of the cube should be chosen as the ranges of those CPPs, hence the experimental range for ammonium acetate quantity was selected as 6 to 8 mmol and for temperature the same was 100 to 110°C (Table 4). In previously published articles, use of ammonium chloride as a catalyst was reported in imidazole formation reaction, when diketo compound and benzaldehyde were the substrates [8]. Role of ammonium chloride was not investigated when ester (1) is used as a starting material for imidazole ring construction. Therefore, we also considered quantity of ammonium chloride as an additional factor to evaluate whether any advantage can be gained with respect to further yield improvement of the process. Range of ammonium chloride was varied from 5 to 10 mmol. Central composite design was selected with 20 runs (Table 5) and six center points (Figure 8). Table 4:Ranges chosen for factors in optimization study (Central composite) Factors Name A Quantity of ammonium acetate B Reaction temperature C Quantity of ammonium chloride Table 5:Details of experimental conditions obtained using central composite design & their corresponding response values Std Run Factor-A 18 1 7 4 2 8 10 3 8.68179 17 4 7 5 5 6 11 6 7 6 7 8 14 8 7 7 9 6 1 10 6 3 11 6 8 12 8 9 13 5.31821 2 14 8 15 15 7 19 16 7 12 17 7 20 18 7 13 19 7 16 20 7 This design provides estimations for all coefficients in a quadratic model, while still employing relatively few experiments. The model was important for estimation of higher order terms which can be better explained by ANOVA analysis (Table 6). Table 6: ANOVA for response surface quadratic model Sum of Source Squares df Model 281.93 9 A-Amm Acetate 191.81 1 B-Rxn Temp 28.5 1 C-Amm Chloride 3.27 1 AB 15.12 1 AC 1.13 1 BC 3.13 1 A2 17.25 1 B2 17.25 1 C2 12.12 1 Residual 3.27 10 Lack of Fit 1.94 5 Unit mmol °C mmol Low 6 100 5 High 8 110 10 Factor-B 105 110 105 105 100 96.591 100 105 110 100 110 110 105 100 105 105 113.409 105 105 105 Factor-C 7.5 5 7.5 7.5 10 7.5 10 11.7045 10 5 5 10 7.5 5 7.5 7.5 7.5 7.5 3.29552 7.5 Response (Y) 87 88 90 87 76 82 87 84 83 79 84 89 78 89 87 88 86 88 85 87 Mean Square 31.33 191.81 28.5 3.27 15.12 1.13 3.13 17.25 17.25 12.12 0.33 0.39 F p-value Prob > F < 0.0001 < 0.0001 < 0.0001 0.0101 < 0.0001 0.0932 0.0114 < 0.0001 < 0.0001 0.0001 Value 95.84 586.82 87.18 10 46.27 3.44 9.56 52.77 52.77 37.09 Significant 1.45 0.3463 Not significant 94
Der Pharma Chemica, 2018, 10(4): 89-98 Tonmoy Chitta Das et al. Design-Expert® Software Yield Predicted vs. Actual Color points by value of Yield: 90 92 90 76 88 86 Predicted 84 82 80 78 76 76 78 80 82 84 86 88 90 92 Actual Figure 8: Diagnostic tool; predicted vs actual plot Design-Expert® Software Factor Coding: Actual Yield (%) Design points above predicted value Design points below predicted value 90 76 90 X1 = A: Amm Acetate X2 = B: Rxn Temp 88 86 Actual Factor C: Amm Chloride = 7.5 84 Yield (%) 82 80 78 76 110 8 108 7.5 106 7 104 6.5 B: Rxn Temp (°C) A: Amm Acetate (mmol) 102 100 6 Figure 9: 3D surface graph of ammonium acetate vs reaction temperature Design-Expert® Software Factor Coding: Actual Yield (%) X1 = A: Amm Acetate X2 = B: Rxn Temp X3 = C: Amm Chloride Cube Yield (%) 83.0477 88.543 B+: 110 83.5262 87.5216 6 B: Rxn Temp (°C) C+: 10 76.1587 87.1541 C: Amm Chloride (mmol) B-: 100 C-: 5 79.1372 88.6326 A-: 6 A+: 8 A: Amm Acetate (mmol) Figure 10: Quadratic model for the yield as cube 95
Der Pharma Chemica, 2018, 10(4): 89-98 Tonmoy Chitta Das et al. Model graphs were derived after ANOVA analysis and diagnostic check. Viewing the quadratic model for the yield as 3D surface graph (Figure 9) and cubic (Figure 10), few conclusions can be drawn: (1) The higher the ammonium acetate quantity, the better the yield, (2) Maxima of the yield is positioned around the middle region of the temperature rage, i.e. 105°C to 107°C, beyond 107°C further decrease in yield observed probably due to product decomposition at higher temperature. Design-Expert® Software Factor Coding: Actual Yield (%) Design points above predicted value Design points below predicted value 90 76 90 X1 = A: Amm Acetate X2 = C: Amm Chloride 88 86 Actual Factor B: Rxn Temp = 105 84 Yield (%) 82 80 78 76 10 8 9 7.5 8 7 7 6.5 C: Amm Chloride (mmol) A: Amm Acetate (mmol) 6 5 6 Figure 11: 3D surface graph of ammonium acetate vs ammonium chloride Evaluating the 3D surface graph of ammonium chloride vs ammonium acetate (Figure 11), it can be concluded that though the interaction was not very significant, but maxima of the yield can be obtained with loading of ammonium chloride between 6 to 7 mmol. Design-Expert® Software Factor Coding: Actual Yield (%) Design points above predicted value Design points below predicted value 90 76 90 X1 = B: Rxn Temp X2 = C: Amm Chloride 88 86 Actual Factor A: Amm Acetate = 7 84 Yield (%) 82 80 78 76 10 110 9 108 8 106 7 104 C: Amm Chloride (mmol) B: Rxn Temp (°C) 6 102 5 100 Figure 12: 3D surface graph of ammonium chloride vs reaction temperature 3D surface graph of ammonium chloride vs temperature (Figure 12), showed minor interaction between these two parameter. In summary, contour plot and 3D surface plot showed significant interactive effect of ammonium acetate mole equivalent and reaction temperature. 96
Der Pharma Chemica, 2018, 10(4): 89-98 Tonmoy Chitta Das et al. Design-Expert® Software Factor Coding: Actual All Responses 1 Desirability Yield (%) 110 110 0 0 X1 = A: Amm Acetate X2 = B: Rxn Temp 0 108 108 Desirability 1 Prediction 86.7253 0 Actual Factor C: Amm Chloride = 6.13531 1 0 1 B: Rxn Temp (°C) B: Rxn Temp (°C) 0 1 106 106 0 0.8 0.4 0 88 0.2 0.6 86 0.2 84 104 104 0.4 0.6 1 0.8 82 102 102 80 100 100 6 6.5 7 7.5 8 6 6.5 7 7.5 8 A: Amm Acetate (mmol) A: Amm Acetate (mmol) Figure 13: Desirability plot Design-Expert® Software Factor Coding: Actual All Responses Actual Factors A: Amm Acetate = 6.73219 B: Rxn Temp = 107.228 C: Amm Chloride = 6.13531 Desirability = 1 Yield (%) = 86.7253 Figure 14: All factor interaction Overlay Plot Design-Expert® Software Factor Coding: Actual Overlay Plot 110 Yield Yield: 86.725 X1 6.73219 X2 107.228 X1 = A: Amm Acetate X2 = B: Rxn Temp 108 Actual Factor C: Amm Chloride = 6.13531 B: Rxn Temp (°C) 106 Yield: 89 Yield: 84 104 102 100 6 6.5 7 7.5 8 A: Amm Acetate (mmol) Figure 15: Overlay plot 97
Der Pharma Chemica, 2018, 10(4): 89-98 Tonmoy Chitta Das et al. Model validation The final goal of our study was to verify the optimal operating points predicted by the model. The desirability plot and all factor interaction for about 86% reaction conversion is described in Figures 13 and 14. Based on the set ranges of factors the DOE software generated solution for optimized response. As shown in Figure 15 the overlay plot ~86.7% yield can be achieved by using 6.73 mmol ammonium acetate and 6.13 mmol ammonium chloride at 107°C. The toluene volume should be kept as 9 volume and reaction time 5.5 h. Three experiments were performed at these predicted optimal points (Table 7). Table 7:Model validation experiments and their responses Factor A (mmol) (°C) 1 6.73 107 2 6.73 107 3 6.73 107 Experimental section Tert-butyl-3-(4-methoxyphenyl)-2-(4-phenyl-1H-imidazole-2yl)propanoate (Optimized procedure): A mixture of ammonium acetate (518.7 mg, 6.73 mmol), ammonium chloride (327.8 mg, 6.13 mmol), and 1-tert-butyl-3-(2-oxo-2-phenylethyl)2-(4-methoxybenzyl)malonate (398.4 mg, 1.0 mmol) in toluene (9.0 ml) was heated to 107°C and the reaction mass was stirred for 5.5 hours at the same temperature. The mass was cooled to room temperature (25°C). The reaction mass was quenched with saturated NaHCO3 (9 ml) solution. Toluene layer separated, dried over Na2SO4 and concentrated in the rotary evaporator. The product was purified by column chromatography (ethyl acetate/n-Hexane=15/85). 1H-NMR (400 MHz, DMSO-d6, 25°C, TMS) δ (ppm): 7.23 (3H, m), 7.37 (2H, m), 7.67 (2H, m), 7.06 (2H, d), 6.79 (2H, d), 3.89 (1H, t), 3.81 (3H, s), 3.32 (1H, d), 3.09 (1H, d), 1.36 (9H, s). For C23H26N2O3 Calculated. C 72.99, H 6.92, N 7.40, Found: C 72.98, H 6.91, N 7.40; HRMS (ESI) [M+H] found: 379.2021. RESULTS AND DISCUSSION The outcomes of these validation or verification experiments were highly precise and those were in accordance with the prediction obtained by the model. This was another indication that data of the fitted model was certainly normally distributed. All the linear, quadratic & interaction model terms of central composite design were significant for the chemical conversion as p value for all the terms were below 0.05 which indicated that conversion was also effected by interaction effects other than the main effects. The final regression model equation in terms of coded factors can be written as below: Yield = +87.32 + 3.75A + 1.44B - 0.49C- 0.37AB + 0.38AC + 0.63BC - 1.09A2 - 1.09B2 - 0.92C2 The equation in terms of coded factors can be used to make predictions about the response for given levels of each factor. The value of each coefficient signifies the extent of influence it has on the response. The sign implies whether it has a positive or adverse effect on the response. CONCLUSION A Statistical model based DOE study was carried out to optimize the reaction conditions for the imidazole ring formation reaction. Critical process parameters were identified by screening DOE. Optimization DOE carried out to generate design space in order to achieve maximum reaction conversion. The operational ranges were identified to avoid fluctuation of the yield range. Individual parameters and their interaction effects were understood. Model validated and finally optimum condition obtained to get reasonably good yield (~87%) by conducting minimum number of reactions. Same methodology can be utilized to optimize many other complex reactions in organic process chemistry. ACKNOWLEDGMENT We acknowledge the management of Dr. Rafiq Zakaria College for women Aurangabad. REFERENCE [1] S.A.I. Quadri, T.C. Das, M.S. Malik, Z.S. Seddigi, M. Farooqui, Chemistry Select., 2016, 1, 4602. [2] Y.H. Lim, Z. Guo, A. Ali, S.D. Edmondson, W. Liu, G. Gallo-Etienne, H. Wu, YD. Gao, A.M. Tamford, (Merck Sharp & Dohme Corp.) US, Int. Application no. PCT/US2015/026774. [3] R.A. Al-Horani, U.R. Desai, Expert Opinion on Therapeutic Patents., 2016, 26, 323-345. [4] C. Wang, J. Corte, K. Rossi, J. Bozarth, Y. Wu, S. Sheriff, J.E. Mayer, J. Luettgen, D.A. Seiffert, R.R. Wexler, M.L. Quan, Bioorg. Med. Chem. Lett., 2017, 27, 4056-4060. [5] D.J.P. Pinto, J.M. Smallheer, R.R. Wexler, Bioorg. Med. Chem. Lett., 2015, 25, 1635-1642. [6] J.R. Corte, W. Yang, P.Y.S. Lam, Bioorg. Med. Chem. Lett., 2017, 27, 3833-3839. [7] A. Chawla, A. Sharma, A.K. Sharma, Der Pharma Chemica., 2012, 4, 116-140. [8] G.E.P. Box, K.B. Wilson, J. R. Stat. Soc. Series B. Stat. Methodol.,1951, 1-45. [9] T. Laird, Organic Process Research & Development., 2002, 6, 337. [10] R. Mullin, Chemical & Engineering News., 2013, 91, 25-28. [11] M. Behrooz, K. Hossein, M. Ali, Oriental J. Chem., 2012, 28, 1207-1212. Factor B Factor C (mmol) 6.13 6.13 6.13 Response (Yield) (%) 86.6 87.2 86.1 Run 98