Download
1 / 65
770 likes | 1.53k Vues
Overview of Curriculum-Based Measurement (CBM) and AIMSweb®. Mark R. Shinn, Ph.D. Michelle M. Shinn, Ph.D. Lisa A. Langell, M.A., S.Psy.S.

E N D
Overview of Curriculum-Based Measurement (CBM) and AIMSweb® Mark R. Shinn, Ph.D. Michelle M. Shinn, Ph.D. Lisa A. Langell, M.A., S.Psy.S.
Summative Assessment: Culmination measure. Mastery assessment. Assessment after instruction. Pass/fail type assessments which summarize the knowledge students learn. Typical summative assessments include: • End of chapter tests • High-stakes tests (e.g., State assessments) • GRE, ACT, SAT, GMAT, etc. tests • Driver’s license test • Final Exams. • Formative Assessment:Process of assessing student achievement frequently during instruction to determine whether an instructional program is effective for individual students. • Informs: • When students are progressing, continue using your instructional programs. • When tests show that students are not progressing, you can change • your instructional programs in meaningful ways. Evaluations to Inform Teaching—Summative & Formative Assessment
Summative & Formative Assessment • Summative Assessment:Characterized as assessment oflearning. • Formative Assessment:Characterized as assessment for learning.(Citation: http://en.wikipedia.org/wiki/Summative_assessment) • Summative assessmenttells you what happened.Formative assessment tells you what’s happening.
Evaluations to Inform Teaching—Diagnostic Assessment • Diagnostic Assessments:Measures that indicate specific skill strengths and those areas needing improvement. Results may indicate skill areas needing intervention/instruction. Programming may then address students’ needs. Examples: • Criterion-referenced assessments • Cognitive assessments • Rating scales • Norm-referenced, standardized assessments • Tests may be based on the assessment ofcognitive skills, academic skills, behavior, health, social-emotional wellbeing, etc.
So, Where Does Curriculum-Based Measurement (CBM) fit? • Summative? • Formative? • Diagnostic?
What is Curriculum-Based Measurement (CBM)? • CBM is a formof Curriculum-Based Assessment (CBA). • CBM is the method of monitoring student progress through direct, continuous assessment of basic skills. • CBM is used to assess skills such reading, spelling, mathematics, and written language. • CBM probes require about 1 to 4 minutes to complete, depending on the skill being measured. • Student performance is scored for speed and accuracy to determine proficiency. • Because CBM probes are quick to administer and simple to score, they can be given frequently to provide continuous progress data. • The results are charted to provide for timely evaluation based on hard data.
Origins of CBM • CBMwas initially developed more than 20 years ago by Stanley Deno and others at the University of Minnesota Institute for Research on Learning Disabilitiesto develop a reliable and valid measurement system for evaluating basic skills growth • CBM is supported by 30 years of school-based research • CBM is endorsed by the United States Department of Education as a method for assessing student progress. • Starting in the area of reading, researchers have expanded to investigate additional academic areas over the years. This includes in-depth research and ultimately the publication of additional measures in literacy, mathematics, and written language • Supporting documentation can be found in 100’s of articles, chapters, and books available within the professional literature describing the use of CBM to make a variety of important educational decisions
Advantages of CBM • Directmeasure of student performance Deno, S.L. (1985). Curriculum-based measurement: the emerging alternative. Exceptional Children. 52(3):219-32. • Correlates strongly with “best practices” for instruction and assessment • Correlates strongly with research-supported methods for assessment and intervention • Focus is on repeated measures of performance(This cannot be done with most norm-referenced and standardized tests due to practice effect or limited forms.)
Common Characteristics of General Outcome Measures • CBM involves the same kind of evaluation technology as other professions. • Powerfulmeasures that are: • Simple • Accurate • Efficientindicators of performancethat guideandinforma variety of decisions • Generalizable thermometer that allows for reliable, valid, cross comparisons of data
Medicine measures height, weight, temperature, and/or blood pressure. Department of Labor measures the Consumer Price Index. Wall Street measures the Dow-Jones Industrial Average. Companies report earnings per share. McDonald’s® measures how many hamburgers they sell. General Outcome Measures (GOMs) from Other Fields
CBM is Used for Scientific Reasons Based on Evidence • Reliable and valid indicator of student achievement • Simple, efficient, and of short duration to facilitate frequent administration by teachers • Provides assessment information that helps teachers plan better instruction • Sensitive to improvement of students’ achievement over time • Easily understood by teachers and parents • Improves achievement when used to monitor progress
Things to Always Remember About CBM • CBMs are designed to serve as “indicators” of general reading achievement: CBM probes don’t measure everything, but they measure the important things • Standardized teststo be given, scored, and interpreted in astandard way • Researchedwith respect to psychometric properties to ensure | accurate measures of learning
Items to Remember (continued) • Are sensitiveto improvement in brief intervalsof time • Also can tell us howstudents earned their scores (offers opportunity to gather qualitative information) • Designed to be asshort as possible (2-4min) to ensure its “do-ability” • Are linkedtodecision making for promoting positive achievement and Problem-Solving
What is AIMSweb®? • AIMSweb® uses CBM. • AIMSweb® is a scientifically based, formative assessment system that 'informs' the teaching and learning process: • Educators only have control over the quality of the instruction and the fidelity with which it is implemented. • Take care not to automatically assume that a lack of progress is always due to lack of effectiveness of the educational programming/intervention. • There may be times when a student’s lack of progress may be attributable to other causes, e.g., transient internal or familial stressors, physical illness, poor attendance. • Addressing programming to include such things as: • Attendance plans • Behavior Plans • Mental health / physical health concerns • AIMSweb® provides continuous student performance data and reports improvement to parents, teachers, and administrators • AIMSweb® enablesevidence-based evaluation and data-driven instruction.
3 2 1 Three-Tiered Assessment Model Tier 3: PROGRESS MONITORIntensive monitoring towards specific goals for students at significant risk for failure Tier 2:STRATEGIC MONITORMonthly monitoring for students who are mild to moderate risk for failure Tier 1: BENCHMARKUniversal Screening for all students
Tier 3:PROGRESS MONITORIntensive monitoring towards specific goals for students at risk for failure 3 2 1 1 Tier 2:STRATEGIC MONITORMonthly monitoring for students who are at mild to moderate risk for failure Tier 1:BENCHMARKUniversal Screeningfor all students Three-Tiered Assessment Model: Benchmark
Universal Screening • Identification of students at-risk for failure • Program evaluation across all students • 1-4 minutes to complete AIMSweb® assessments • Some AIMSweb® assessments are individually administered, while others may be done as a group. 1 BENCHMARK : Universal Screening
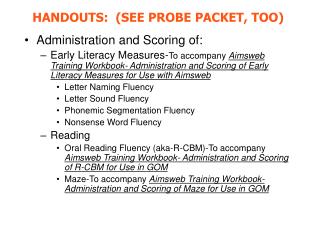
Measures Currently Available via AIMSweb®: • Early Literacy[K-1 benchmark, Progress Monitor (PM) any age] • Letter Naming Fluency • Letter sound fluency • Phonemic Segmentation Fluency • Nonsense Word Fluency • Early Numeracy (K-1 benchmark, PM any age) • Oral Counting • Number identification • Quantity discrimination • Missing number • Oral Reading (K-8, PM any age) • MAZE (Reading comprehension); (1-8, PM any age) • Math Computation (1-6, PM any age) • Math Facts (PM any age) • Spelling (1-8, PM any age) • Written Expression (1-8, PM any age) All students in an academic curriculum are “benchmarked” three times per year across any/all of these assessment areas.
Optional R-CBM Activity:Learning the Process of Benchmark Data Collection and Analysis:Short Case Studies
Data: Get the MEDIAN score for student’s 3 passages: CORRECT WORDS 67 / 2 85 / 8 74 / 9 1 min. 1 min. 1 min. Why use Median vs. Average? Averages are susceptible to outliers when dealing with small number sets.Median Score is a statistically more reliable number than average for R-CBM.
MEDIAN SCORE: 74/8 (Report in AIMSweb®) NOTE: R-CBM is the only measure for which the median score is calculated. Data: Get the MEDIAN score for student’s 3 passages: ERRORS 67 / 2 85 / 8 74 / 9 1 min. 1 min. 1 min. Why use Median vs. Average? Averages are susceptible to outliers when dealing with small number sets.Median Score is a statistically more reliable number than average for R-CBM.
BENCHMARK DATA ACTIVITY • Your Certified AIMSweb® Trainer (CAT) will assign you a number, from 1 to 4 • Open up your workbook to: • Calculate the Median Score for the student (number) you were assigned WRC = Words Read Correct ERRORS = Number of Errors • Wait for all trainees to finish the exercise. Your trainer will confirm accuracy momentarily. WRC/Errors Example: 64/2
54 2 (All identifying information and scores are fictitious.)
98 9 (All identifying information and scores are fictitious.)
79 12 (All identifying information and scores are fictitious.)
48 12 (All identifying information and scores are fictitious.)
Easy Score Entry Once data are collected, it is easily entered into AIMSweb®’s web-based software. Simply type in the scores! (pictured at left) Dozens of reports are then instantly available. (Estimated time: 3-5 minutes.) (All identifying information and scores are fictitious.)
AIMSweb as a Program Evaluation Tool: Benchmark 3x/year for Universal Screening—AllKids (All identifying information and scores are fictitious.)
Michael Martin: A student with Benchmark Data that indicates he is performing significantly behind peers at his school.
Fall Benchmark Data for Michael Martin Martin, Michael: Grade 5 (All identifying information and scores are fictitious.)
3 1 2 Average Range (middle 50%) Box & Whiskers Graphs (box plots): A 3-Step Explanation AIMSweb commonly uses box plots to report data. AIMSweb’s Box plots are somewhat similar in shape and representation as to a vertical bell curve. Michael Martin Above 90th percentile * Above Average Range * 90th percentile Target Line * • 75th percentile • Median (50th percentile) • 25th percentile Average range of population included in sample. * * Below Average Range * 10th percentile Below 10th percentile * *In relation to user-defined comparison group
AIMSweb Comparison Group Choices/Options: • All students in grade-level at student’s school (pictured left) • All students in grade-level across student’s school district • All students in grade-level across multiple districts within account • All students in grade-level within student’s state* • All students in grade-level nationally (Aggregate Norms)* • (Comparison group includes all students for whom data are reported using AIMSweb® web-based software) AIMSweb® “Box & Whiskers Graphs” / Comparison Groups: Michael Martin (All identifying information and scores are fictitious.)
Discussion: Consider Michael’s R-CBM performance in relationship to different AIMSweb® Comparison Groups Grade 5:Michael’s School Grade 5: Michael’s District Grade 5: National Aggregate Norms (All identifying information and scores are fictitious.)
Discussion: SAMPLE STUDENT Grade 5:Luis’s School Grade 5: Luis’s District Grade 5: National Aggregate Norms
Consider modifying instructional program(s) • Consider increasing frequency of assessment to assess efficacy of alternate program(s) • Review data regularly to assess progress Michael appears to be performing below expectationswhen compared to all three comparison groups. Grade 5:Michael’s School Grade 5: Michael’s District Grade 5: National Aggregate Norms (All identifying information and scores are fictitious.)
Individual Report: 3rd Grade Student • QUESTIONS: • What does report suggest about Viviana’s progress? • What does report suggest about the school’s progress for its 3rd grade students? • What if you saw this pattern in only one school’s 3rd grade within your district? • What if you saw this pattern across most or all 3rd grade groups in your district?
Data to Know When Things are Working • QUESTIONS: • What does report suggest about Jamie Connor’s progress? • What does report suggest about the school’s progress for 3rd grade students? • What if you saw this pattern in only one school’s 3rd grade within your district? • What if you saw this pattern across most or all 3rd grade groups in your district?
Data to Know that Things Went Well • QUESTIONS: • What does report suggest about Heather A’s progress? • SPRING: Compared to Grade 3 peers at her school, is Heather performing in the: - Well Above Average Range? - Above Average Range? - Average Range? - Below Average Range? - Well-Below Average Range?
Have Data to Know When ThingsNeed Changing • QUESTIONS: • What does report suggest about U. Boardman’s progress? • What are possible reasons why U. Boardman might not be making progress? • What might happen if nothing is done to address U. Boardman’s needs? • Without this type of visual data, collected at each Benchmark period, do you believe U. Boardman’s stagnation would have been quickly noticed otherwise?
Data to Know that ChangesMade a Difference • QUESTIONS: • What does report suggest about U. Boardman’s progress by spring? • What are possible reasons why U. Boardman might be making progress? • What does this report suggest about the progress Grade 3 students made from winter to spring? • Could program changes that impacted U. Boardman simultaneously positively impact the whole class? • How could this report be used for parent conferences? Grade level team meetings? Other ideas?
Identifying Students At-Risk for Failure • QUESTIONS: • What does report suggest about Lindsey’s progress (Spring)? • What are possible reasons why Lindsey might not be making progress? • Based on this report, is Lindsey’s instruction assisting her in closing the performance discrepancy between her school’s Grade 5 peers? • How would this report be helpful if Lindsey were not currently receiving Tier 2 support? Tier 3? Special Education / Special Programs? • How would this report still be helpful if Lindsey was alreadyreceiving Special Education?