Download
1 / 31
310 likes | 513 Vues
Centre of Research for Energy Resources and Consumption. Modeling of Squirrel Cage Turbine for Voltage Dips Studies. M.P. Comech, S. Martín, J. Mur, I. Franco, M. García-Gracia.

E N D
Centre of Research for Energy Resources and Consumption Modeling of Squirrel Cage Turbine for Voltage Dips Studies M.P. Comech, S. Martín, J. Mur, I. Franco, M. García-Gracia
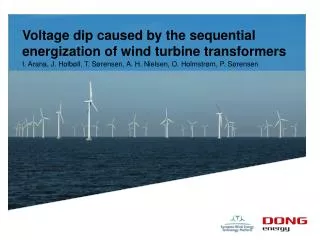
The number of wind energy installations is rapidly growing worldwide. With increasing wind power production, it is important to predict the grid interaction of wind turbines. • In the past, wind turbine generators were allowed to disconnect from the system during faults. Nowadays, there is an increasing requirement for wind farms to remain connected to the power system during faults, since the wind power lost might affect the system stability.
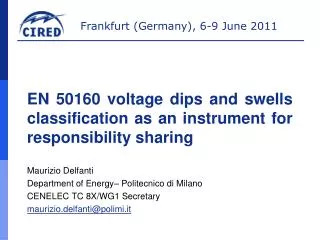
When a fault happens, the system voltage at that point is essentially brought to zero volts. The flow of current into the fault results in voltage drops throughout the network. This effect is commonly named voltage dip. Loss of generation during voltage dips can affect system stability. Due to this fact, Wind farms shall be able to withstand voltage dips with the depth and the duration described on Grid Code. U ↓ U≈0 U ↓
The behavior of wind farms during voltage dips is analyzed by means of dynamic simulation. • PSS/E: • Is a widely recognized tool of power system operators • its results tie closely with what is measured in real life • wind farms have to be modeled to allow the investigation of the behavior of wind generators and their impact on the electric power system,. • The aim of this paper is to investigate the modeling requirements of wind turbine for power system studies. • The study is applied to a squirrel cage wind turbine.
Generation without sufficient fault ride through Generation reserve is needed Generation tripping Fault The Fault Ride-Through • The increasing interest in wind generation has brought a number of areas of Grid Code into focus, which means severe difficulties for wind farms. • The area of fault ride through capability is one with serious implications for system security and thus has implication for the level of penetration of wind generation allowed on the network. During system perturbances the system stability depends on the generators connected to the system to restore the system to normal operation. Disconnection of generation in the event of system faults would lead to local voltage problems and power quality issues and, in extreme, system collapses.
The Fault Ride-Through • European system operators have come to a different ride through capabilities. • There are two different groups of requirements: • First group: Turbines must remain connected to the HV system, for a specified minimum duration, for a fault resulting in zero volts at the point of common coupling. • Second group: Turbines must remain connected to the HV system, for a specified minimum duration, for a fault resulting in a minimum stated voltage at the point of common coupling. E.ON Netz voltage dip curve.
Behaviour closest to the real wind turbine but the computational cost may be excessive there must be agreement between the detail level and the computational cost. Model Requirements Dynamic simulation allows to verify that the wind farm fulfill the requirements imposed by new grid code. Very detailed model Different modeling options are analyzed in order to obtain the requirements that must fulfill the model used for the simulation of fault ride-through.
Switching and protective equipment Generator Mechanical drive unit Transformer, power lines… Control and supervision Consumers, storage… Model Requirements Fixed speed wind turbine scheme: Rotor
Rotor Model • The wind turbine rotor extracts the energy from the wind and converts it into mechanical power. • The rotor is a complex aerodynamic system that can be modeled with different detail levels. • There are models that consider the rotor geometry and the distribution of the wind in the rotor → the computation time become complicated and lengthy. • To solve this problem, a simplified rotor model is normally used when the electrical behavior of the system is the main point of interest. • An algebraic relation between wind speed and mechanical power extracted is assumed: • Where Cp is the performance coefficient that depends on λ, the tip speed ratio:
Switching and protective equipment Generator Mechanical drive unit Transformer, power lines… Control and supervision Consumers, storage… Model Requirements Fixed speed wind turbine scheme: Rotor
TT ωT θT TG ωG θG K JT JG D Shaft System Model • There are different representations of the shaft system in the literature: • Sometimes, representation of the shaft system was neglected, and the mechanical construction of the wind turbines was modeled as a lumped-mass system with the lumped inertia constant of the turbine rotor and the generator rotor: • The two mass model is the most popular in investigation of transient voltage stability.
Switching and protective equipment Generator Mechanical drive unit Transformer, power lines… Control and supervision Consumers, storage… Model Requirements Fixed speed wind turbine scheme: Rotor
q-axis Vs d-axis Generator model The basic mathematical equations to represent induction motors and generators were developed many years ago. In these equations the three-phase stator and rotor windings of an induction machine can be represented by two sets of orthogonal fictitious coils. The next equations have been developed by considering the following assumptions: • The stator current was assumed positive when flowing from the machine. • The equations were derived on the synchronous reference. • The q-axis was assumed to be 90 º ahead of the d-axis with respect to the direction of rotation. • The q component of the stator voltage was selected as the real part of the busbar voltage and d component was selected as the imaginary part.
Generator model The per unit equations in the reference frame described are: 3rd order model 5th order model 1st order model The movement equation describes the induction generator behavior:
Circuit 1 MV HV Equivalent wind turbine model Circuit 2 Detailed model Equivalent wind turbine model HV MV Circuit n Equivalent model HV MV Wind farm model • The model of the wind farm can be considered to have two levels of representation: • The detailed model, representing individual units and the connections between these units and the system • The equivalent wind farm, modeled as seen from the system. The individual generators are lumped into equivalent machines represented at the collector buses. The size of the system representation is reduced to a few buses and the data requirements are reduced. The equivalent model enables the model order and the computation time to be reduced. • Stability studies can have up to hundreds of wind farms composed of a large number of wind turbines; therefore it is difficult to know the distribution of the wind inside each park. Due to the lack of data, the equivalent used in this study does not take into account the wind speed distribution.
Z Wind Turbine Z/2 Z/2 Electrical network Wind turbine P = 600kW U=690 V t = 4 s Doble busbar External network Scc>>20Sn Simulated Network
Circuit 1 Bus 6 220 kV Bus 1 132 kV Bus 3 132 kV MV External network Line 1 Line 2 Circuit 2 Wind Farm Circuit n Conection Externalnetwork ≈2000buses Wind farm 13 WT P = 600kW U = 690 V t = 4 s Transformer 20/132 kV Simulated Network
Z Wind Turbine Z/2 Z/2 Electrical network Analysis I: Shaft system model influence
Z Wind Turbine Z/2 Z/2 Electrical network Analysis II: Generator order model influence First Order Model Third Order Model Fifth Order Model
Z Wind Turbine Z/2 Z/2 Electrical network Analysis II: Generator order model influence First Order Model Third Order Model Fifth Order Model
Z Wind Turbine Z/2 Z/2 Electrical network Analysis II: Generator order model influence Third Order Model Fifth Order Model
Analysis II: Generator order model influence • The simulation of large power systems with wind turbines modeled by the fifth order model can last hours, because of the integration step needed in this model. For that reason the third order model is more useful than the fifth order model, when large power system is studied. Nevertheless, the influence of this assumption has to be analyzed. • To investigate the influence of the generator model the System 2 has been simulated.
Bus 6 220 kV Bus 1 132 kV Bus 3 132 kV External network Line 1 Line 2 Wind Farm Analysis II: Generator order model influence Third Order Model Fifth Order Model
Bus 6 220 kV Bus 1 132 kV Bus 3 132 kV External network Line 1 Line 2 Wind Farm Analysis II: Generator order model influence Third Order Model Fifth Order Model
Analysis II: Generator order model influence.Conclusions • The results obtained in the generation bus by means of the third order model are, approximately, the surrounding curves of the obtained by the fifth order model • Third and fifth order model can achieve identical results when the zones analysed are distant to wind turbines • Fifth order model needs a smaller integration step, and simulation time increases Third order models are preferred for dynamic simulation of large power systems
Bus 6 220 kV Bus 1 132 kV Bus 3 132 kV External network Line 1 Line 2 Wind Farm Analysis III: Wind farm model influence Equivalent Model Detailed Model
Bus 6 220 kV Bus 1 132 kV Bus 3 132 kV External network Line 1 Line 2 Wind Farm Analysis III: Wind farm model influence Equivalent Model Detailed Model
Bus 6 220 kV Bus 1 132 kV Bus 3 132 kV External network Line 1 Line 2 Wind Farm Analysis III: Wind farm model influence Equivalent Model Detailed Model
Bus 6 220 kV Bus 1 132 kV Bus 3 132 kV External network Line 1 Line 2 Wind Farm Analysis III: Wind farm model influence Equivalent Model Detailed Model
Conclusions • In this paper, wind turbine modeling requirements have been analyzed. • Models must be suitable for investigating the impact of large power systems. • The proposed model: • Simple rotor model • Shaft system: Two mass model • Generator model: 3rd order model • Wind farm model: Aggregated model • It shows a behavior closest to the real wind turbine behavior with a not excessive computational cost. The precision obtained is enough to have a good estimation of the wind farm behavior in large power system.
Centre of Research for Energy Resources and Consumption Modeling of Squirrel Cage Turbine for Voltage Dips Studies