Inference on Proportions
230 likes | 264 Vues
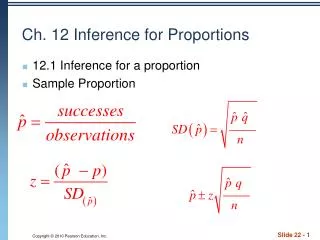
Inference on Proportions. What are the steps for performing a confidence interval?. Assumptions Calculations Conclusion. 1. Assumptions:. SRS of context Approximate Normal distribution because np > 10 & n(1-p) > 10 Population is at least 10n (tests independence). Normal curve.

Inference on Proportions
E N D
Presentation Transcript
What are the steps for performing a confidence interval? • Assumptions • Calculations • Conclusion
1. Assumptions: • SRS of context • Approximate Normal distribution because np > 10 & n(1-p) > 10 • Population is at least 10n (tests independence)
Normal curve 2. Formula for Confidence interval: Note: For confidence intervals, we DO NOT know p – so we MUST substitute p-hat for pin both the SD & when checking assumptions.
3. Conclusion Statement • We are X% confident that the true proportion of whatever is happening in context of the problem is between A and B.
A January 2015 poll that Ms. Nichols totally made up a random sample of 2015 high school AP students, 814 said that Calculus is more fun than Statistics. Find a 90% confidence interval for the true proportion of AP students who think that Calculus is more fun than Statistics.
Assumptions: SRS of AP students YES Approx. Normal: 2015 (814/2015) > 10 YES 2015 (1-814/2015) > 10 YES Independence: pop. >10(2015) YES Calculations: Conclusion: We are 90% confident that the true proportion of AP students who think Calculus is more fun that Statistics is between .3860 and .4220.
A May 2000 Gallup Poll found that 38% of a random sample of 1012 adults said that they believe in ghosts. Find a 95% confidence interval for the true proportion of adults who believe in ghost.
Assumptions: • Have an SRS of adults • np =1012(.38) = 384.56 & n(1-p) = 1012(.62) = 627.44 Since both are greater than 10, the distribution can be approximated by a normal curve • Population of adults is at least 10,120. Step 1: check assumptions! Step 2: make calculations Step 3: conclusion in context We are 95% confident that the true proportion of adults who believe in ghosts is between 35% and 41%.
To find sample size: However, since we have not yet taken a sample, we do not know a p-hat (or p) to use! Another Gallop Poll is taken in order to measure the proportion of adults who approve of attempts to clone humans. What sample size is necessary to be within + 0.04 of the true proportion of adults who approve of attempts to clone humans with a 95% Confidence Interval?
.1(.9) = .09 .2(.8) = .16 .3(.7) = .21 .4(.6) = .24 .5(.5) = .25 By using .5 for p-hat, we are using the worst-case scenario and using the largest SD in our calculations. What p-hat (p) do you use when trying to find the sample size for a given margin of error?
Another Gallop Poll is taken in order to measure the proportion of adults who approve of attempts to clone humans. What sample size is necessary to be within + 0.04 of the true proportion of adults who approve of attempts to clone humans with a 95% Confidence Interval? Use p-hat = .5 Divide by 1.96 Square both sides Round up on sample size
Steps for a Hypothesis Test Check Assumptions (same as Conf. Int.) State Hypotheses Calculate the test statistic (Z) Calculate the p-value State Conclusion
Hypotheses for proportions: H0: p = value Ha: p > value where p is the true proportion of context Use >, <, or ≠
Calculating the P-Value • The p-value is the probability that you get your result by chance alone assuming the null hypothesis is true • Use normalcdf • Let mean = 0, SD = 1 • For less than: z = UB • For greater than z = LB
Conclusion Statement Note: Unless otherwise stated in the problem assume that α is 0.05 α is also called the significance level If the p-value < α… Since the p-value is less than α we reject the null hypothesis. There is sufficient evidence to suggest that the true proportion of what we are calculating the proportion of in the problem is greater/less/differentthan original p in problem. If the p-value is > α… Since the p-value is greater than αwe fail to reject the null hypothesis. There is not sufficient evidence to suggest that the true proportion of what we are calculating the proportion of in the problem is greater/less/differentthan original p in problem.
A company is willing to renew its advertising contract with a local radio station only if the station can prove that more than 20% of the residents of the city have heard the ad and recognize the company’s product. The radio station conducts a random sample of 400 people and finds that 90 have heard the ad and recognize the product. Is this sufficient evidence for the company to renew its contract?
Assumptions: • Have an SRS of people • np = 400(.2) = 80 & n(1-p) = 400(.8) = 320 - Since both are greater than 10, this distribution is approximately normal. • Population of people is at least 4000. Use the parameter in the null hypothesis to check assumptions! H0: p = .2 where p is the true proportion of people who Ha: p > .2 heard the ad Use the parameter in the null hypothesis to calculate standard deviation! Since the p-value >a, I fail to reject the null hypothesis. There is not sufficient evidence to suggest that the true proportion of people who heard the ad is greater than .2.
A new reality TV show, “I Want to Marry a Statistician,” has been showing on Monday evenings, and ratings showed that it has been watched by 55% of the viewing audience each week. The producers are moving the show to Wednesday night. They are interested in whether or not the move had affected the ratings. After the show was moved, a random sample of 500 people who watch TV on Wednesday night are surveyed and asked what show they are watching. 255 respond with “I Want to Marry a Statistician.” Were the ratings affected by the move at the .1 level of significance?
Assumptions: SRS of viewers YES 500(.55) > 10 and 500(.45) > 10 YES Pop. of TV watchers > 5000 YES H0: p = .55 Where p is the true proportion of people Ha: p ≠ .2 watching the show Since the p-value is less than α I reject the null hypothesis. There is sufficient evidence to suggest that the proportion of people watching the show on Wednesday is different from what it was on Monday.
For hypothesis testing when you DON’T need to do a complete write up…. • H0 and Ha • The test statistic (Z) • The p-value • Reject or fail to reject H0 • Answer the question (yes or no) Note: You must do a complete write-up on the AP test