Chapter 8 Inference for Proportions
Chapter 8 Inference for Proportions. 8.1 Inference for a single proportion. Recall: Proportions (p). For each individual in the study, we record a binary outcome (Yes/No; Success/Failure) rather than a continuous measurement

Chapter 8 Inference for Proportions
E N D
Presentation Transcript
Chapter 8Inference for Proportions 8.1 Inference for a single proportion
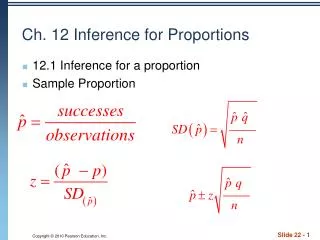
Recall: Proportions (p) • For each individual in the study, we record a binary outcome (Yes/No; Success/Failure) rather than a continuous measurement • Compute a sample proportion, (pronounced “p-hat”), by taking observed number of “yes’s” divided by total sample size • p represents the true population proportion. In practice this value is unknown.
Recall: The Normal Approximation for Proportions • Draw a SRS of size n from a large population having population proportion p of successes. Let X be the count of successes in the sample and p = X/n the sample proportion of successes. When n is large, the sampling distribution of these statistics are approximately normal: • P ~ N(p,[(p(1-p))/n]1/2) • As a rule of thumb, we will use this approximation for values of n and p that satisfy np > 10 and n(1-p) >10.
The Sample Proportion:An Example • 26% of infants born to HIV-positive women test positive for the virus at, or shortly after, birth. • Researchers believe that the risk that a pregnant woman who is HIV-positive will infect her baby is associated directly with the mothers infection status. • In a random sample of 150 babies born to women with high viral levels (suggesting advanced infection), 107 infants were HIV-positive. • P=107/150 = 0.7133 • Do these data support the expectation that the proportion of babies born to HIV-positive mothers with advanced infection differs from 26%?
The Sample Proportion:An Example • The mean and variance of the sampling distribution for the sample proportion are:
Recall: Steps in Hypothesis Testing • State the null hypothesis H0 and the alternative hypothesis Ha. • Calculate the value of the test statistic on which the test will be based. • Find the p-value for the observed data. • State a conclusion.
Hypothesis Testing Steps:One Proportion • Step 1: State your hypotheses • H0: p= p0 • Ha: p p0 or Ha: p <p0 or Ha: p >p0 • Step 2 : Calculate your test statistic (z statistic is appropriate provided you have a SRS of size n from a large population.
Hypothesis Testing Steps:One Proportion • Step 3: Calculate the p-value One or two-sided. • Step 4: Make your conclusion. If p-value < a, then reject Ho If p-value > a, then do not reject Ho
Hypothesis Testing for a Population Proportion: An Example • Step 1: State your hypotheses • H0: p= p0 = 0.26 • Ha: p 0.26 • Step 2 – Calculate your test statistic
Hypothesis Testing for a Population Proportion: An Example • Step 3 – Calculate the p-value • The probability that a standard normal variable Z takes a value at least 12.66 standard deviations above and below zero. • P-value=2*P(Z 12.66) <0.001 • A proportion as large as that observed would not likely occur by chance.
Hypothesis Testing for a Population Proportion: An Example • Step 4- Make your conclusion • At a significance level of 0.01 we would reject the null hypothesis. • The proportion of babies infected when a mother’s HIV infection is advanced (0.7133) is significantly different than the overall population proportion (0.26).
Confidence Intervals for the Population Proportion • From the sampling distribution of the sample proportion we can create a confidence interval for the population proportion p. • Choose a SRS of size n from a large population with unknown proportion p of successes. • Because we are creating a confidence interval about p, we cannot calculate the standard error of p. We substitute p for p in the standard error calculation.
Confidence Intervals for the Population Proportion: The Wilson Estimate • The Wilson Estimate is an adjustment to the value of the population proportion. This is because our estimate of the standard error of p is not very good. • This adjustment appears to yield more accurate results when constructing confidence intervals about a proportion. • Add two success and two failures to your observed proportion. • Note: You are not required to do your confidence intervals using the Wilson Estimate.
Confidence Intervals for the Population Proportion: The Wilson Estimate • What the heck!!@@@@@???!!! • Why do we do this adjustment? • Consider tossing a coin 3 times and you get heads 3 times. • Pretend you do not know p=0.5 • Then, Here the standard error equals zero!! We know that is not true. We adjust by moving p away from zero by adding 2 successes and 2 failures (Wilson’s Estimate).
Confidence Intervals for the Population Proportion: An Example • Suppose that n=25 newborn infants of obese women are sampled and x=10 weigh less than 2500 grams. Create a 95% CI for the population proportion (p).
Confidence Intervals for the Population Proportion: An Example Using Wilson’s Estimate • Suppose that n=25 newborn infants of obese women are sampled and x=10 weigh less than 2500 grams. Create a 95% CI for the population proportion (p).