Ch. 12 Inference for Proportions
180 likes | 470 Vues
Ch. 12 Inference for Proportions. 12.1 Inference for a proportion Sample Proportion. Section 12.2. Comparing two proportions. Comparing Two Proportions. Comparisons between two percentages are much more common than questions about isolated percentages. And they are more interesting.

Ch. 12 Inference for Proportions
E N D
Presentation Transcript
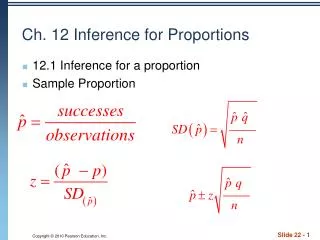
Ch. 12 Inference for Proportions • 12.1 Inference for a proportion • Sample Proportion
Section 12.2 Comparing two proportions
Comparing Two Proportions • Comparisons between two percentages are much more common than questions about isolated percentages. And they are more interesting. • We often want to know how two groups differ, whether a treatment is better than a placebo control, or whether this year’s results are better than last year’s.
The Standard Deviation of the Difference Between Two Proportions • Proportions observed in independent random samples are independent. Thus, we can add their variances. So… • The standard deviation of the difference between two sample proportions is • Thus, the standard error is
Assumptions and Conditions • Independence Assumptions: • Randomization Condition: The data in each group should be drawn independently and at random from a homogeneous population or generated by a randomized comparative experiment. • The 10% Condition: If the data are sampled without replacement, the sample should not exceed 10% of the population. • Independent Groups Assumption: The two groups we’re comparing must be independent of each other.
Assumptions and Conditions (cont.) • Sample Size Condition: • Each of the groups must be big enough… • Success/Failure Condition: Both groups are big enough that at least 10 successes and at least 10 failures have been observed in each.
Sample: Among randomly sampled teens aged 15-17, 57% of the 248 boys had posted online profiles, compared to 70% of the 256 girls. Can we use these results to make inferences about all 15-17 year-olds?
The Sampling Distribution • We already know that for large enough samples, each of our proportions has an approximately Normal sampling distribution. • The same is true of their difference.
The Sampling Distribution (cont.) • Provided that the sampled values are independent, the samples are independent, and the samples sizes are large enough, the sampling distribution of is modeled by a Normal model with • Mean: • Standard deviation:
Two-Proportion z-Interval • When the conditions are met, we are ready to find the confidence interval for the difference of two proportions: • The confidence interval is where • The critical value z* depends on the particular confidence level, C, that you specify.
Sample: Among randomly sampled 15-17 year olds, 57% of the 248 boys had posted online profiles, compared to 70% of the 256 girls. We calculated the standard error for the difference in sample proportions to be .0425 and found that the assumptions and conditions required for inference were met. What does a confidence interval say about the difference in online behavior?
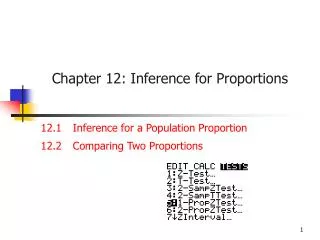
TI-Tips Find a Confidence Interval STATS TESTS B:2-PropZInt 57% of the 248 boys = 141.36 (round to nearest int.) 70% of the 256 girls = 179.2 (round to nearest int.) (Put data in, largest %, then smallest %)
Hypothesis Test for the Difference in Two Proportions • The typical hypothesis test for the difference in two proportions is the one of no difference. In symbols, H0: p1 – p2 = 0. • Since we are hypothesizing that there is no difference between the two proportions, that means that the standard deviations for each proportion are the same. • Since this is the case, we combine (pool) the counts to get one overall proportion.
TI-Tips Two-proportion z-test Stat Tests 6:2-PropZTest Enter numbers for each group Choose tail. Determines the z-value and p-value!
What Can Go Wrong? • Don’t use two-sample proportion methods when the samples aren’t independent. • These methods give wrong answers when the independence assumption is violated. • Don’t apply inference methods when there was no randomization. • Our data must come from representative random samples or from a properly randomized experiment.