Download

1 / 24
240 likes | 610 Vues
Cosmic Connection between Black Hole Growth and Galaxy Evolution. Jong-Hak Woo UCLA. Local Scaling Relations. M BH - relation (Ferraresse et al. 2000; Gebhardt et al. 2000). M BH – L spheroid relation (Magorrian et al. 1998; Marconi & Hunt 2003). Log M BH. Log M BH.

E N D
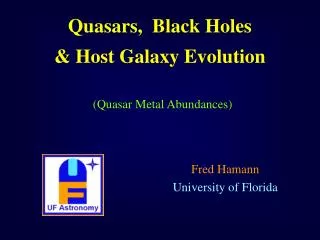
Cosmic Connection between Black Hole Growth and Galaxy Evolution Jong-Hak Woo UCLA
Local Scaling Relations MBH- relation (Ferraresse et al. 2000; Gebhardt et al. 2000) MBH – Lspheroid relation (Magorrian et al. 1998; Marconi & Hunt 2003) Log M BH Log M BH Marconi & Hunt (2003) Tremaine et al. (2002) Dispersion () km/s Log Lspheroid K
An Open Question: origin of scaling relations • When did scaling relations form? Do they evolve? • Theoretical Predictions: • No evolution? (Haehnelt & Kauffmann 2000) • Galaxy grows first? (Robertson et al. 2005) • BH grows first ? (Croton 2006; Bower et al. 2006; Somerville et al. 2008) • Core issues: • BH growth faster than bulge growth? Or synchronized? • transforming stellar disk to spheroid component
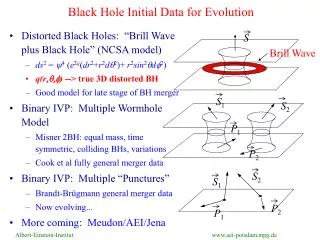
Determining Black Hole Mass Cannot resolvethe sphere of influence for SMBHs beyond ~20Mpc! Solution: Active galaxies with broad-lines 1) Velocity: from width of broad lines 2) Broad-line region size (RBLR): from either Reverberation time scale (light echo) between accretion disk and BLR or Continuum luminositybased on the empirical size-luminosity relation (Kaspi et al. 2005; Bentz et al. 2006). MBH ~ RBLR V2 /G
EmpiricallyCalibrated Photo-Ionization Method How to estimate BLR size • The flux needed to ionize the broad line region scales as L/r2. • An empirical correlation is found, calibrated using reverberation mapping BLR size (lt-days) L(5100A) (erg/s) Kaspi et al. 2005
Cosmic evolution of MBH- & MBH-Lspheroid relations Collaborators: Tommaso Treu (UCSB), Matt Malkan (UCLA), & Roger Blandford (Stanford) Sample selection • 2 redshift windows: z=0.360.01 and z=0.570.01to avoid sky lines • samples: 35 objects at z=0.36 & 15 objects at z=0.57, selected from SDSS, based on broad H • Observations • z=0.36, initial sample: 20 objects with Keck spectra & HST ACS images • lower MBH sample:15 objects with Keck spectra & HST NICMOS • z=0.57: Keck spectra for 15 objects; sigma measured for 5 • HST NICMOS; 6 obtained so far
z=0.36 sample Measuring velocity dispersion Estimating MBHMBH ~ RBLR V2 /G z=0.57 sample
MBH - sigma at z~0: quiescent vs. Seyfert galaxies AGNs seem to follow the same M-sigma relation on average, but with shallower slope and larger scatter Reverberation sample: Velocity dispersion from Onken et al. 2004 SDSS sample: Velocity dispersion from Greene et al. 2007 Woo et al. 2008
Scaling Relation at z~0.4 & 0.6 Distant bulges are smaller/less luminous than local bulges at fixed MBH Dispersion () km/s Log Lspheroid B Treu et al. 2007 Woo et al. 2006, 2008
Evolution of MBH - sigma Relation? z=0.36 sample Δlog MBH = 0.54±0.12±0.21 z=0.57 sample Δlog MBH = 0.50±0.22±0.21 Woo et al. 2008
Mass-dependent Evolution? More massive galaxies show smaller offset Downsizing of scaling relation? Woo & Treu 2009
Mass-dependent Evolution? Log M BH At z~2, most massive objects are offset from the local relation Log Lspheroid B Peng et al. 2006
Recent evolution of (active) bulges? z~0.36 sample (Treu et al. 2007)
Recent evolution of (active) bulges? NICMOS images of lower MBH sample at z~0.36 (Bennert et al. 2009) NICMOS images of z~0.57 sample
Mass-dependent Evolution? More massive galaxies show smaller offset Lower MBH sample will be crucial to determine the mass-dependency
What about MBH – sigma relation of AGNs at z~0? MBH-sigma relation is defined with low-mass, low-luminosity Seyferts Lack of high MBHAGNs due to the difficulty of sigma measurements sigma of PG quasars can be measured in H band (using Keck AO+OSIRIS)
What about MBH – sigma relation of AGNs at z~0? MBH-sigma relation is defined with low-mass, low-luminosity Seyferts Lack of high MBHAGNs due to the difficulty of sigma measurements sigma of PG quasars can be measured in H band (using Keck AO+OSIRIS) Watson et al. 2008 Gemini NIFS data
What about MBH – sigma relation of AGNs at z~0? MBH-sigma relation is defined with low-mass, low-luminosity Seyferts Lack of high MBHAGNs due to the difficulty of sigma measurements sigma of PG quasars can be measured in H band (using Keck AO+OSIRIS)
LAMP (Lick AGN Monitoring Project) PI: Aaron Barth (UC Irvine) CoI: N. Bennert (UCSB), M. Bentz (UCI), G. Canalizo (UCR), J. Greene (Princeton), M. Malkan (UCLA), A. Filippenko (UCB), E. Gates (UCSC), D. Stern (JPL), Tommaso Treu (UCSB), J.-H. Woo (UCLA) • Motivation • To increase the reverberation sample size, at low mass scale • To better determine the size-luminosity relation (led by M. Bentz) • To study M-sigma relation at low mass scale (led by J.-H. Woo) • Sample 12 local Seyfert galaxies with low BH mass • Observation 65 nights at Lick (spectroscopy) and at ~1-m telescopes (photometry) • Results Bentz et al. (2008), Woo et al. (2009 in prep.) etc
Conclusions • For given MBH, bulges at z~0.36 & 0.57 appear to be smaller/less luminous compared to the local sample. • Selection effects: possibly in the local relationship; mass-dependency, AGN vs. quiescent galaxies, spirals vs. bulge dominated systems? • BH growth predates final assembly of spheroid at intermediate mass scale • AGN M-sigma relation at z~0 with near-IR spectroscopy and new reverberation masses will lead us to better understanding of origin of scaling relation.
Observational limitations at distant universe Solution: Active galaxies with broad emission lines 1) Reverberation mapping(Blandford & McKee 1982) 2) Empirical size-luminosity relation, based on reverberation sample(Wandel et al. 1999; Kaspi et al. 2005). 1) Black hole mass: CANNOT resolve the sphere of influence (1” at z=1 is ~8 kpc) 2) Velocity dispersion: CANNOT avoid AGN continuum Solution: Seyfert 1 galaxies integrated spectra have enough starlight to measure on the featureless AGN continuum. 3) Spheroid luminosity: high spatial resolution required Solution: HST imaging
How to measure BLR size reverberation mapping by measuring time lag (light echo) between accretion disk and BLR (Blandford & McKee 1982) • Reverberation mapping requires along term monitoring! Continuum Light curves of NGC 5548 Emission line flux variation lags by ~20 days Emission line Peterson et al. 2004
Recent evolution of (active) bulges? lower MBH sample at z~0.36 (Bennert et al. 2008)
Interpretation 1) Systematic errors? Stellar contamination,aperture correction, inclination overall systematic errors: Δlog MBH = 0.21 dex, smaller than offsetΔlog MBH ~ 0.50 dex • 2) Selection effects? • Monte Carlo simulation shows selection effect ~0.1dex. • Difference in active and quiescent galaxies? • Scaling relation not tight for late-type galaxies? • Mass-dependant evolution? 3) Cosmic evolution? BH growth predates bulge assembly. These bulges have to grow significantly to arrive in the scaling relations at z=0