Download
1 / 22
220 likes | 408 Vues
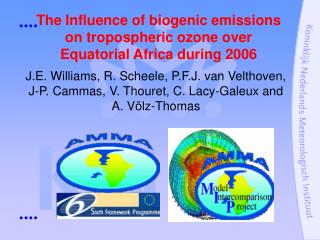
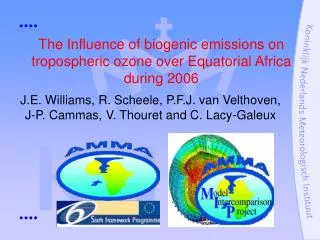
The Impact of Biogenic VOC Emissions on Tropospheric Ozone Formation in the Mid-Atlantic Region. Michelle L. Bell Yale University. Hugh Ellis Johns Hopkins University. Air Pollution 2005 May 17, 2005. Tropospheric Ozone (O 3 ).

E N D
The Impact of Biogenic VOC Emissions on Tropospheric Ozone Formation in the Mid-Atlantic Region Michelle L. Bell Yale University Hugh Ellis Johns Hopkins University Air Pollution 2005 May 17, 2005
Tropospheric Ozone (O3) • Secondary pollutant formed by complex chemical reactions including NOx and Volatile Organic Compounds (VOCs) • Linked to human health effects including decreased lung function and increased emergency room visits • Subject to NAAQS under the U.S. Clean Air Act • Estimating O3 concentrations important from a public health and regulatory standpoint
Attainment of 8-Hour Standard Attainment or unclassified Non-attainment (entire county) Non-attainment (partial county) November 2004 Source: EPA Greenbook
Air Quality Modeling Emissions: Transportation Industry Biogenic • Meteorology • Wind • Precipitation • Solar Radiation Inputs: Terrain Land-Use
Models-3 Framework MM5 (Meteorological Modeling System) CMAQ (Community Multi-scale Air Quality) LUPROC (Land-Use Processor) MEPPS (Models-3 Emissions Processing and Projection System) MCIP (Meteorology-Chemistry Interface Processor) INPRO (Input Processor) EMPRO (Emission Processor) ECIP (Emissions-Chemistry Interface Processor) CCTM (CMAQ Chemical Transport Model) OUTPRO (Output Processor) JPROC (Photolysis Rate Processor) SAS MEPRO (Models-3 Emissions Projections Processor) ICON (Initial Conditions Processor) Arc/Info BCON (Boundary Conditions Processor) IDA (Inventory Data Processor)
Domain 1 Domain 1: 108-km grid cell resolution Domain 2: 36-km grid cells Domain 3: 12-km grid cells Domain 4: 4-km grid cells Domain 1 Domain 2 Domain 2 Domain 3 Domain 3 Domain 4 Domain 4 Domain 1: 108-km grid cell resolution Domain 3: 36-km grid cells Domain 2: 12-km grid cells Domain 4: 4-km grid cells Case Study Area (Mid-Atlantic, USA)
12-km Resolution Domain 42 Rows 69 Columns 2898 Cells
Baltimore, MD X X Washington, DC 4-km Resolution Domain (Maryland) 45 Rows 60 Columns 2700 Cells
Model Evaluation • How well does the modeling system perform? • Are ozone estimates reasonable approximations of monitor values? • Several approaches applied comparing model estimates to monitor measurements (Bell & Ellis Atmospheric Environment 2004) • E.g. Mean bias = 6.2 ppb
x Comparison of Values at Hour of Maximum ConcentrationJuly 13 to 15, 1995
Comparison of Model Estimates and Measurements (8-hour average) Location: Millington, Maryland 8-hr Average O3 (ppb) Local Time
Modeling Simulations • 27June1990 (h 00) to 30June1990 (h 00) (GMT) • High ozone episode • Emissions Scenarios • Baseline (actual emissions) • 100% increase in biogenic emissions • 100% increase in biogenic and motor vehicle emissions
Scenario B Biogenics 100% Scenario C Biogenics and Motor Vehicles 100%
Scenario Comparisons • Ozone Concentrations • Maximum hourly average, maximum 8-hour average, daily average, episode average, domain-wide average, etc. • Absolute values, increases, relative increases • Comparisons are affected by what pollution metric is used (Bell & Ellis JAWMA 2005)
Scenario Comparisons – Some Results • All emissions scenarios had higher O3 in some areas/times and lower O3 in others • The increase in motor vehicle emissions had less of an impact than the same relative % increase in biogenic emissions.
25 20 15 10 5 0 Rural Urban Rural vs. Urban Areas Avg. increase in Hourly Max (ppb) Scen C - baseline Scen B - baseline
VOC vs. NOx- sensitivity • 13July1995 (h 00) to 15July1995 (h 00) (GMT) • Scenarios • Baseline scenario (actual emissions) • VOCs and NOx increased 25% • VOCs only increased 25% • NOx only increased 25%
Areas for which the VOC increase always resulted in higher O3 than the NOx increase. Areas for which the NOx increase always resulted in higher O3 than the VOC increase.
Concluding Thoughts +Air pollution modeling can be a useful tool for many purposes –Must believe in results (validation) Results • Demonstrate the importance of biogenic VOCs for the Mid-Atlantic Region of the U.S. • Show that generalizations such as VOC-sensitivity or NOx-sensitivity are over simplifications Thank you