Download
1 / 25
250 likes | 411 Vues
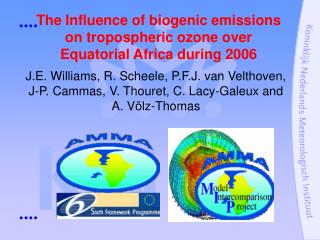
The Influence of biogenic emissions on tropospheric ozone over Equatorial Africa during 2006. J.E. Williams, R. Scheele, P.F.J. van Velthoven, J-P. Cammas, V. Thouret and C. Lacy-Galeux. Objectives of the study.

E N D
The Influence of biogenic emissions on tropospheric ozone over Equatorial Africa during 2006 J.E. Williams, R. Scheele, P.F.J. van Velthoven, J-P. Cammas, V. Thouret and C. Lacy-Galeux
Objectives of the study • A climatological biogenic emission inventory is available as part of the RETRO emission database – how is it different than previous inventories ?? • How does this modify the tropical troposphere in a global CTM compared to the most common inventories adopted by the modelling community?? • How influential is the emission of NO from soils towards the composition of the African troposphere in a CTM?? • What about the effect of the additional biogenic volatile organic compounds??. • How do biogenic emissions from Africa influence the oxidative capacity of the global troposphere??
Biogenic NO emissions Regions: (_) Saharan (40-20°N), (_) Sahel (10-20°N), (_) Guinea (0-10°N), and (_) southern Africa(40-0°S) Yienger and Levy (1995) vs Lathiére et al (2006)
Isoprene Emissions (incl monoterp) Regions: (_) Saharan (40-20°N), (_) Sahel (10-20°N), (_) Guinea (0-10°N), and (_) southern Africa (40-0°S) Guenther et al (1995) vs Lathiere et al (2006)
Volatile Organic Compounds Regions: (_) Saharan (40-20°N), (_) Sahel (10-20°N), (_) Guinea (0-10°N), and (_) southern Africa (40-0°S) Additional VOC’s : CH3COOH, HCHO and CH3CHO Different inventories: Acetone, C2H5OH
Percentage differences in annual global fluxes for Africa Fraction = LATH/POET Longitudinal differences not shown but emission regions do shift with season
Sensitivity studies • 34 layers,3° x 2°, ECMWF 6 hour re-analysis • Lightning NOx, biomass burning and anthropogenic emissions kept equal throughout. • Base run using POET inventory for global biogenics w/ RETRO Anthro/GFEDv2 (POET). • Sensitivity run using Lathiere et al (2006) biogenics w/ RETRO Anthro/GFEDv2 (LATH). • Sensitivity run: LATH but no SOIL NO in Africa (NOSOIL). • Sensitivity run: LATH but no BVOC,s in Africa (NOBIO). (CO,C2H4,C2H6,C3H8,C3H6,C2H5OH,CH3CHO, CH3COOH, acetone and HCHO) • 2D cross-section between 12-21E : 3hrly output of selected trace species averaged into seasonal means.
Chemical Mechanism • Modified CBM4 mechanism w/ latest reaction data (64 reactions, 16 photochemical reactions, 4 aqueous phase reactions) – lumped mechanism NO + HO2 NO2 + OH (60.9%) NO + CH3O2 HCHO + HO2 + NO2 (19.4%) NO + C2O3 HCHO + XO2 + HO2 + NO2 (3%) NO + XO2 NO2 (16.5%) NO + O3 NO2 (night time conversion) NO2 + hv O3 OH + NO2 HNO3 NO2 + C2O3 ↔ PAN (main source Isoprene Ox. Via aldehydes) NO2 + XO2N ORGNTR (main source Isoprene Oxidation) Minor radical reservoirs : HNO4, N2O5
LATH-POET/LATH • [O3] shows regionalsimilarities with [NO]↑ • (c.f. DJF – s.Africa). • [Isoprene] signature when [NO]↑ is ~ equal. • (c.f. MAM – s.Africa) • In the absence of strong [NO]↑ less [O3] in LATH.
LATH-POET/LATH • [PAN] shows regional similarities with [Isoprene]↑ • (10S-10N). • Main source of CH3C(O)O2 • Low in Sahara. • Weak [PAN] on [NO] ↑ BB NOx + [Isoprene]
LATH-POET/LATH • [HNO3] shows regional similarities with [O3] • O3 + h (+H2O) 2OH • OH + NO2 HNO3 • 5% More N deposition as HNO3 adds to decreases in [O3] for the background
LATH-POET/LATH • [OH] shows regional similarities with [O3] • O3 + h (+H2O) 2OH • Weaker oxidation capacity in Lath POET LATH
LATH-NOSOIL/LATH • Soil NOx responsible for >40% [O3] near the source regions. • [O3] through the • entire column – not • limited to lower tropo.
LATH-NOSOIL/LATH [OH] shows regional similarities with [O3] O3 + h (+H2O) 2OH Background [OH] decreases - weaker oxidation capacity
LATH-NOSOIL/LATH [HNO3] shows regional similarities with [O3] O3 + h (+H2O) 2OH Double effect of less [NO2] and less [O3]
MOZAIC profiles from Windhoek (22.5°S, 17.5°E) • LATH agrees better with MOZAIC profiles • Largest diff • shown by NOSOIL run • Effect of soil NOx propagates up the column High Soil NOx in DJF (_) POET, (_) LATH, (_) NOSOIL, (_) OBS
MOZAIC in-flight data over Africa Soil NOx High [O3] over biomass burning regions is not captured (_) POET, (_) LATH, (_) NOSOIL, (_) OBS
French and German Falcons + UK BAe146 No simulation captures the high [O3] in measurements Lack of variation in soil NO emission between measurements Low [O3] captured ! Analysis software Courtesy B Josse
TM4 generally over-estimates surface [O3] in remote regions by 50-100% Suggests over production near strong BB sources which is transported over measurement sites (_) POET, (_) LATH, (_) NOSOIL, (_) OBS
Both POET and LATH overpredict [NO2] For some stations soil NO emissions account for nearly 100% of the resident [NO2]. (_) POET, (_) LATH, (_) NOSOIL, (_) OBS
Generally too [HNO3] is too low for many months [O3] and [NO2] both too high. OH + NO2 HNO3 Why [HNO3] is low ?? Missing source or exaggerated sink?? (_) POET, (_) LATH, (_) NOSOIL, (_) OBS
Conclusions • The seasonality, distribution and annual fluxes for biogenic species are quite different for distinct regions of Africa between the two emission inventories. • TM4 becomes less chemically active when adopting the new biogenic inventory which increases the lifetime of dominant trace gases such as CO. • Soil NOx influences [O3] throughout the troposphere over Africa when the effect is integrated over time. • Comparisons with measurements suggest more monthly variability should be introduced into the Lathiére Climatology (weekly?). • Production of [O3] due to soil NO emission in Africa reduces the global atmospheric lifetime of CH4 and CO by 3% and 4%, respectively. To be submitted to AMMA ACP Special Issue