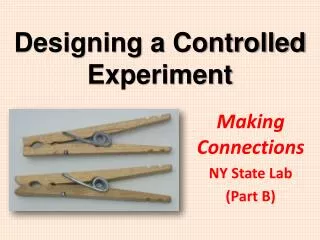
A Controlled Experiment
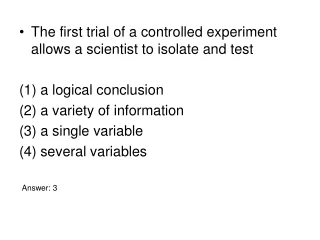
A Controlled Experiment. Part of the scientific method. Variables. A factor that can change. A variable can change other factors when it changes. Examples of variables: -Temperature -Light - Open vs. Closed container -Location -Time -Elevation -Pressure.

A Controlled Experiment
E N D
Presentation Transcript
A Controlled Experiment Part of the scientific method
Variables • A factor that can change. A variable can change other factors when it changes. Examples of variables: -Temperature -Light - Open vs. Closed container -Location -Time -Elevation -Pressure
Quantitative and Qualitative • A Quantitative Variable is one that is measured using numbers. Examples: temperature is measured in degrees, length can be measured in centimeters. • A Qualitative variable is one that can not be measured in numbers, but by its qualities. Such as bright, clear, rough, smooth, pain.
Independent vs. Dependent Variables • The dependent variable is a factor that changes because the independent variable changes. However the independent variable is not changed by the dependent variable. • Example: Elevation and Boiling temperature of water. The boiling temperature of water changes because of changes in elevation. Changes in the boiling temperature of water do not change elevation.
Graphing Variables • The Independent variable is always graphed on the X axis. • The dependent variable is always graphed on the Y axis.
Hypothesis is a testable statement that can be proven false. Can be a prediction of an outcome Hypothesis can become a theory once it is supported by enough evidence. Theories are supported by multiple observations or experiments A theory may be proven false or modified when more data is collected Usually the lest complicated explanations Hypothesis vs. Theory
Control -A variable or factor that does not change in the experiment. It remains constant. In a Controlled experiment only one variable is allowed to change at a time. Everything else remains constant.
Francisco Redi & Spontaneous Generation OBSERVATIONS: Flies land on meat that is left uncovered. Maggots appear on the meat. HYPOTHESIS: Flies produce maggots. Covered jars Uncovered jars VARIABLES Controlled Variables: jars, type of meat, location, temperature, time After several days Independent Variables: gauze (keeps flies away from meat) Dependent Variable: whether maggots appear Maggots appear No maggots appear CONCLUSION: Maggots form only when flies come in contact with meat. Spontaneousgenerationof maggots did not occur.
Replicates • In an experiment multiple copies of the experiment are done at the same time. • This is to ensure that the results are accurate (true) and not due to a mistake, error or chance event.
Treatments • Set of variables in the experiment that are the same in each group of replicates. • 2 Treatments Covered Uncovered