Deuterium Uptake Dynamics of PGC-1α at Varied pH Levels: A Comparative Study
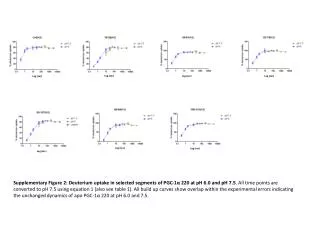
This supplementary figure presents deuterium uptake measurements in selected segments of PGC-1α 220 at pH 6.0 and pH 7.5. All time points are normalized to pH 7.5 based on the provided equation. The build-up curves indicate that the deuterium uptake dynamics of apo PGC-1α 220 remain consistent across the two pH conditions, as demonstrated by overlapping data within experimental error margins. This suggests that pH variations do not significantly impact the structural dynamics of PGC-1α.

Deuterium Uptake Dynamics of PGC-1α at Varied pH Levels: A Comparative Study
E N D
Presentation Transcript
Log (sec) Log (sec) Log (sec) Log (sec) Log (sec) Log (sec) Log (sec) Supplementary Figure 2: Deuterium uptake in selected segments of PGC-1α 220 at pH 6.0 and pH 7.5. All time points are converted to pH 7.5 using equation 1 (also see table 1). All build up curves show overlap within the experimental errors indicating the unchanged dynamics of apo PGC-1α 220 at pH 6.0 and 7.5.