Truth Model in Data Analysis: Ensuring Accuracy and Reliability
Explore the importance of truth models in data analysis, understanding filter efficiency, sensitivity to model mismatches, model identification, and verification using examples from GP-B data analysis. Learn about model-based estimation, optimization, and validation techniques.

Truth Model in Data Analysis: Ensuring Accuracy and Reliability
E N D
Presentation Transcript
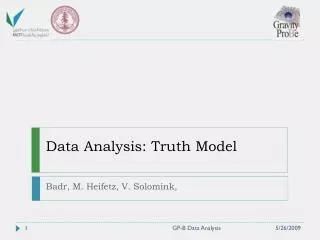
Data Analysis: Truth Model Badr, M. Heifetz, V. Solomink, GP-B Data Analysis
Why We Need Truth Model • Filter efficiency estimation based on the truth model. • Filter properties are easier to be determined when the truth is known. • Sensitivity to the filter-model mismatch. • Is the current model a sufficient representation of the real system? Are all parameters need to be determined? • Model Identification. • Model verification. (Tom) GP-B Data Analysis
Relativity Estimate -state vector Telescope Data TFM Data Module Module Module Aberration Data Roll Phase Data Module Module Module h-Jacobian - Module IEKF/ SPT Module Truth Model Relativity Estimate uncertainty SQUID Data Module Residual Analysis - KACST Module Optimization Module-based Functional Block Diagram GP-B Data Analysis
Relativity Estimate -state vector Telescope Data TFM Data Module Module Module Aberration Data Roll Phase Data Module Module Module Truth Model - SQUID Data Module Residual Analysis Truth Model Block Diagram SPT Noise + Bias GP-B Data Analysis
SQUID Signal SQUID Readout Signal Model GP-B Data Analysis
Gyroscope Motion: Torque Model TFM GP-B Data Analysis
Generated Squid Signal * Actual -- Gen. (V) (V) (V) GP-B Data Analysis
Generated vs. Actual Squid Actual and Generated Squid signal difference Actual and Generated Squid signal difference plus noise -Mean= 0.000706 +/- 0.007779 (V) (V) (V) 1/f generated noise (Tom) GP-B Data Analysis
Result Generated Trajectory (NS) • Similar results were obtained for all four gyros. Generated Trajectory (EW) arcsec arcsec GP-B Data Analysis
MATLAB Calls • S0= ZsquidTruth2go(‘initi’, X, iXc, iXg, GYROS); • Inputs: Assigned state vector, state index, and Gyro properties. • Outputs: Initial position (each segment), and stores the state vector. • [ SO, Z ]= ZsquidTruth2go(‘getZ’, ‘GSV / GSI’, S0, tSpan, …. GYROS); • Inputs: Initial position, time, and case. • Output: last trajectory, and Z{gyro#}= [t, Hnom, H, S]; • It calls existing functions: any changes can be easily updated. The truth model is integrated in the 2 sec. Filter. GP-B Data Analysis