Download
1 / 18
210 likes | 446 Vues
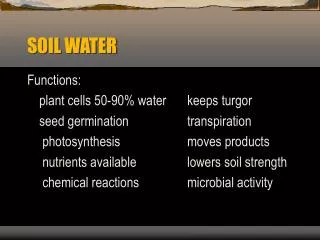
Soil, Water, and Plants. Young Scholars Program – Grade 3. Scientific Investigation Process. Wheel of Scientific Investigation. Step 1: Make Observations. Record your observations about the soil samples in your response journals. Sample bags contain: Rocks/Gravel Clay Sand Topsoil.

E N D
Soil, Water, and Plants Young Scholars Program – Grade 3 Scientific Investigation Process
Step 1: Make Observations Record your observations about the soil samples in your response journals. Sample bags contain: • Rocks/Gravel • Clay • Sand • Topsoil Use your curiosity and senses to learn. Set up your journal to record your observations for each sample bag.
Be prepared to share some of the your questions. Step 2: Ask Questions I Wonder if… • Topsoil • Rocks/Gravel • Clay • Sand
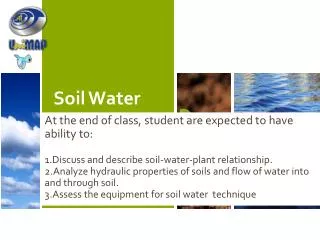
Step 3: Learn More How can we find the answers to our questions? • What is that one question we want answered? • What do we already know about our question? • Where can we find the answers to our question?
Step 4: Design the Experiment Hypothesis Conduct an experiment to determine how much water different types of soil can absorb. • Rank your soil samples from “least absorbent” to “most absorbent.” • Now state your hypothesis…”We predict that the order of soil samples from least absorbent to most absorbent will be…
Step 4: Conduct the Experiment Steps Record the steps of the experiment in your response journal so that you are consistent with each sample bag. Follow the exact steps for the remaining soil samples. • Place the filter paper over the top of the jar. Make a shallow dent in the middle to hold the soil. Secure with a rubber band. • Fill the dent with some of the soil sample. • Carefully measure ¼ cup of water. • Slowly pour the water evenly over the soil sample. Designate one group member to watch the inside of the jar while the water is being poured. • Record observations: • What happens when the water is poured? • What does the sample look, feel, and smell like after the water has been poured? • Remove the filter paper and pour the water in the jar into the measuring cup. How much of the ¼ cup of water is left?
Step 4: Conduct the Experiment Record Data Record observations with great detail.
Comparison Table Layout A second line of text can go here. Here is the description of the table. You may change or delete this text as you wish. This table is compatible with PowerPoint 97 to 2007.
Bar Graph Page Layout A Second Line of text may go here Here is the description of the chart. You may change or delete this text as you wish. This chart is compatible with PowerPoint 97 to 2007. Here is a placeholder for more text and description of the chart. Changing this text will not interfere with the formatting of this template.
Pie Graph Page Layout PowerPoint 97 through 2007 Compatible Here is the description of the chart. You may change or delete this text as you wish. This chart is compatible with PowerPoint 97 to 2007. Here is a placeholder for more text and description of the chart. Changing this text will not interfere with the formatting of this template. Star Burst!
Pie Graph Page Layout PowerPoint 97 through 2007 Compatible Here is the description of the chart. You may change or delete this text as you wish. This chart is compatible with PowerPoint 97 to 2007. Here is a placeholder for more text and description of the chart. Changing this text will not interfere with the formatting of this template. Star Burst!
Bar Graph Page Layout PowerPoint 2007 Enhanced Version Here is the description of the chart. You may change or delete this text as you wish. This chart utilizes features only available with 2007. Here is a placeholder for more text and description of the chart. Changing this text will not interfere with the formatting of this template. A callout, this can be edited or deleted
Pie Graph Page Layout PowerPoint 2007 Enhanced Version Here is the description of the chart. You may change or delete this text as you wish. This chart utilizes features only available with 2007. Here is a placeholder for more text and description of the chart. Changing this text will not interfere with the formatting of this template.
Smart Art Page Layout PowerPoint 2007 Enhanced Version This chart utilizes Smart Art which is feature in PowerPoint 2007. If you wish to make charts like this and don’t have PPT 2007, we have provided the graphical elements to help you build this yourself. Here is the description of the chart. You may change or delete this text as you wish. Here is a placeholder for more text and description of the chart. Changing this text will not interfere with the formatting of this template.
Smart Art Page Layout PowerPoint 2007 Enhanced Version This chart utilizes Smart Art which is feature in PowerPoint 2007. If you wish to make charts like this and don’t have PPT 2007, we have provided the graphical elements to help you build this yourself. Here is the description of the chart. You may change or delete this text as you wish. Here is a placeholder for more text and description of the chart. Changing this text will not interfere with the formatting of this template.
Smart Art Page Layout PowerPoint 2007 Enhanced Version This chart utilizes Smart Art which is feature in PowerPoint 2007. If you wish to make charts like this and don’t have PPT 2007, we have provided the graphical elements to help you build this yourself. Here is the description of the chart. You may change or delete this text as you wish.
Picture Page Layout Here is a place holder for the text. The earth flower on this page can be removed. Picture from PresenterMedia.com