Download
1 / 17
170 likes | 332 Vues
Michael O’Connor, GISWR Fall 2013. Riparian Contributions to ET in Austin, TX. The Problem. Water resources are critical to manage in dry, large, and growing population centers Austin, Austin, and Austin

E N D
Michael O’Connor, GISWR Fall 2013 Riparian Contributions to ET in Austin, TX
The Problem • Water resources are critical to manage in dry, large, and growing population centers • Austin, Austin, and Austin • We are unable to accurately assess how much water we must conserve unless we know how much water we HAVE • And thus how much we LOSE • The least constrained term in almost all water budgets is evapotranspiration • Impossible to measure directly; difficult to model • Riparian zones are large areas that are heavily with respect to water conservation • Thus, constraining water budget terms for riparian zones is helpful in determining effective conservation practices
Evapotranspiration (ET) in the Water Budget • Connects each individual parcel of land to the atmosphere hydrologically • Climate buffer • Heavily dependent on vegetative profiles
Breaking Down ET • Evaporation • The physical process of the phase change of water • Can occur on free-water surfaces or within porous surfaces, although that is a very slow process • Directly dependent on RADIATION
Breaking Down ET • Transpiration • Evaporation that is ‘aided’ by plants • Plants, hydrologically speaking, are merely transport tubes that move moisture from the soil to the atmosphere (Soil-Plant-Atmosphere Continuum) • Water exits a plant through its leaves, and more specifically through stomata • Holes in leaves • The ‘openness’ of the stomata depends on the type of plant in question and its water-use patterns
Direct modeling through Penman-Monteith • ET is dependent on a number of factors ,where: • (Rn-G) is a radiation term • (es-ea) is the vapor pressure deficit (humidity term) • rs represents stomatal resistance… • And all other terms are constants calculated from temperature
Water Budget Modeling • Break a system down into a series of grid cells and model the entire water budget for the system • This is what the NLDAS attempts to do • Models such as these require incredible inputs • Land cover • Vegetation mapping • Topography
My Project: Stream Contributions • Determine Austin average daily ET in riparian zones using Penman-Monteith (P-M) and GIS • Collected of accurate model parameter information for a typical Austin riparian profile • Radiation • Humidity/temperature • Stomatal conductance • Ran P-M model for said environment • Extrapolated calculated ET over riparianareas of Austin
My Project: Stream Contributions • Determine Austin average daily ET over a month using NDLAS and ArcMAP • Downloaded hourly data for evaporation and transpiration for selected time frame over the same aerial extent as my P-M calculations • Calculated zonal averages for each hour across the month
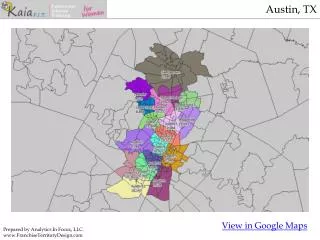
My Project: Study Area • The outer line represents the political boundary of the City of Austin • For P-M modeling, the two distinct ecoregions of Austin were considered because their vegetation profiles differ • A separate shapefile was utilized to determine canopy regions • This shapefile was considered the modeling extent for NLADS modeling and P-M area extrapolation
My Project: Results • Riparian Zones (Jan. avg): • Perennial streams, Edwards: 470 m^3/day • Intermittent streams, Edwards: 4500 m^3/day • All streams, BlacklandPrarie: 5840 m^3/day • Total riparian ET: 10,820 m^3/day • NLDAS Approximation (Jan. avg): • Total potential ET: 1.72E09 m^3/day
My Project: Results • Areal Comparison • Riparian: 5.7 km^2 • Total city: 704 km^2 • Riparian share: 0.8% of total city area • Riparian share of ET: 0.0006% of total city ET • NOT a large contributor, even when water is flowing high
My Project: Discussion • Scaling up is difficult! • P-M showed MUCH higher water losses due to ET than the NLADS model (double!) • Sources of error all seem plant-based: • NLADS does not consider plant type, thus does not accurately account for the transpiration occurring • My study averaged plant communities that most likely can not be averaged • Stomatal conductance data was taken from labs and not tested directly
Future Work • Analyze more months (just fixed Python code so this is coming!) • Perform sap-flow measurements or pan evaporation measurements to ‘check’ NLADS and P-M • More accurately survey and determine Rs values
Questions? Thanks to Dr. Maidment, Dr. Tarboton, and Dr. Moffett for assistance with this project