Download
1 / 7
70 likes | 179 Vues
This document examines the simulation issues related to low flow conditions in riparian zones, focusing on the Platte River at Grand Island during 2002-2005. It highlights discrepancies between surface water and groundwater models, which often show wet conditions, contrasted with observed dry periods. Investigations into evapotranspiration (ET) simulation reveal significant contributing factors, particularly in riparian wetlands. A modified ET model demonstrates improved alignment with historical data, providing insights for better groundwater management and addressing low flow challenges.

E N D
RIPARIAN ET CONTRIBUTIONS TO LOW FLOW CONDITIONS April 2013 COHYST Workshop
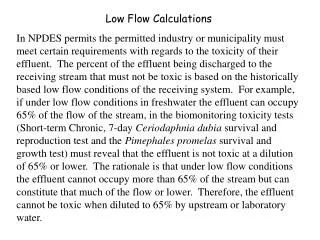
Simulation Issues • The models do not include recent driest years. • The Platte at Grand Island is dry at times during 2002-2005. • The surface water model has low flow in the 2002-2005 period but is never dry. • The ground water model is always wet at Grand Island. • The data shows losses from Odessa to Grand Island while the ground water model shows gains.
Looking for causes • A survey of the groundwater model for causes of the stream flow problem found contributing factors in the simulation of riparian ET. • ET surface elevations set at or near the highest elevations in a cell and ET extinction depths can be above much of land surface. • ET is not simulated in cells with stream boundaries, where much of the riparian wetlands are located.
Toward a solution • Tested a simple ET representation to see if the ET simulation might be a factor • Set ET surface at the average ground level • Set ET extinction depth constant at 8 feet below ET surface • Set the maximum ET rate to the pond evaporation rates times an adjustment value (67%) • Subtracted 12 inches/year for the ET rate that might be simulation in the watershed model • Multiplied the rate by the proportion of each model cell where the land cover (NLCD, 2001) was open water, riparian forest or emergent wetlands.
A result: Odessa – Grand Island Original Model Modified Model
Comparisons • The modified model simulated CPNRD’s 1997 average ET rate at 26.6 inches/year on 126,000 acres of riparian forest, wetlands and open water (assuming 12 inches year simulated by the watershed model). • CPNRD 1997 riparian forest ET 172,000 acre-feet over 76,225 acres for an average rate of 27.1 inches/year (Woodward). • Landon et al (2009) reported an ET rate of 21.7 inches/year in riparian forest at a site near Odessa