Chapter 14 - Reconstructing Past Climates
Chapter 14 - Reconstructing Past Climates. In order to understand the present and future climates on earth and other planets, we must learn about past climates, what affected them, and how they have changed. Proxy data

Chapter 14 - Reconstructing Past Climates
E N D
Presentation Transcript
Chapter 14 - Reconstructing Past Climates In order to understand the present and future climates on earth and other planets, we must learn about past climates, what affected them, and how they have changed.
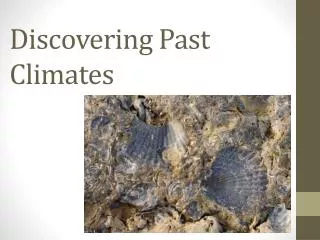
Proxy data • any set of non-climatic evidence collected that is a function of temperature and/or moisture • Examples: • Pollen • Lake levels • Fossils • Chemical isotopes
Ice cores • Used for centuries as crude climate indicators • If present = cold; if thicker=more snow; if thinner=warmer and less snow • First ice cores extracted (1950’s) were used in old ways • 1980’s everything changed • Utilized dust, gases, and chemicals
Oxygen isotopes-paleotemperature proxy • an isotope is an element with extra neutrons in the nucleus of the atom • Means there is a weight difference • Oxygen has two isotopes • 18O and 16O • 16O weighs slightly less so it evaporates more easily when attached to water (H2O)
As ocean water is depleted in 16O, it is enriched (relatively speaking) in 18O. In essence, as we enter a glacial period, ocean waters are enriched in 18O. In ice, 16O is enriched during glacial times. Values are typically presented as a % change or a ratio of 16O/18O, in part because the isotopes are also affected by temperature and can vary in the numeric values.
Plants give us a good estimation of past climates due to their immobility and dependence upon precipitation and temperature • modern climatological classification schemes exploit this • Look for relative abundance of preserved plant remains • Macrofossils- leaves, twigs, bark, etc • Microfossils- pollen and spores
Plots of pollen grains vs depth (time) • Pollen plots look to exploit rapid shifts in the types of pollen grains found • Plants are great colonizers when an ecological niche is unoccupied due to extinction or extantism
Dendrochronology- study of tree rings trees record environmental stress Thick rings = good growing conditions Thin rings = stressed conditions
Non-stressed stressed
Sea level curve (eustatic) Eustasy- a change in the volume of water held in the ocean basins As sea rises or falls, landforms are created that give away the former position of water levels beaches and wave cut platforms coral reefs
Lake levels • Water accumulates in closed or semi-closed basins • occurs due to increased precipitation and/or decreased evaporation • As levels rise, landforms are created • As levels fall, new landforms are created • Both leave an identifiable record of prior water levels, which reflect moisture in the region
Lake levels- Lake Bonneville
Holocene climatic optimum • 9-7 Kyr bp (7-5000 BC) • many regions experience a climatic optimum- warm summers mild winters. • Accelerates sea level rise due to deglaciation
Historic records of meteorological events • non-instrumental accounts • restricted to weird or extreme events • Recorded in literature, birth and death records, art works and theater productions from those time periods. • instrumental accounts and records • In the renaissance, science became enamored with measuring stuff • First temperature, then wind, moisture, and pressure
Little Climatic optimum • occurs from about 800 to 1300 AD • records of civilizations abound in what are now harsh climatic regions • Greenland- “Norse” colonies • Wari Empire- Peru, South America • Pueblo culture - Chaco Canyon, NM • Anasazi culture- Mesa Verde, CO • Causes problems in some coastal areas • Sea level rises flooding places along the Mediterranean Sea
Little “Ice Age”- Occurs from 1350- to 1850 AD Produces cooler weather and forces the termination of all of the cultures mentioned in association with Climatic optimum ice becomes commonplace in places that do not currently freeze e.g., Thames River- England