Estimating Climate Sensitivity from Past Climates: Understanding Feedbacks and Forcings
This overview discusses the estimation of climate sensitivity using a zero-dimensional climate model. It explores crucial concepts such as climate feedback mechanisms, distinguishing between forcings and feedbacks, and the significance of paleocalibration in understanding historical climate conditions. The balance of incoming solar radiation and outgoing terrestrial radiation is examined to elucidate why discrepancies exist between calculated and actual temperatures. Furthermore, we delve into various feedback types, including snow-ice-albedo, water vapor, lapse rate, and cloud feedbacks, and their impact on climate dynamics.


Estimating Climate Sensitivity from Past Climates: Understanding Feedbacks and Forcings
E N D
Presentation Transcript
Outline • Zero-dimensional model of climate system • Climate sensitivity • Climate feedbacks • Forcings vs. feedbacks • Paleocalibration vs. paleoclimate modeling • Estimating past forcings • Estimating past temperatures
Global Energy Balance Emitted Terrestrial Radiation Incoming Solar Radiation Earth’s temperature is determined by the balance between these two energy fluxes.
Global Energy Balance Incoming SolarRadiation Outgoing TerrestrialRadiation = S0 · πr2 · (1-α) σT4 · 4πr2 = solarirradiance cross-sectionalarea of Earth absorbedfraction emittedinfrared flux surface areaof Earth
Temperature Calculated temperature is 255 K, but actual global mean surface temperature is 288 K. Why is there is discrepancy? sTe4 The “average photon” is being emitted from a level of 5 km at a temperature of 255 K. The Greenhouse Effect—which is due to presence of water vapor, CO2, CH4, N2O in the atmosphere. These gases absorb and re-emit infrared radiation, so photons emitted from the surface and lower atmosphere have a lower probability of escaping to space than do photons emitted from the upper atmosphere. 255 K 288 K
A Simple Question • If we alter Earth’s radiation balance by 1 W m-2 and allow the climate system to fully adjust, how much will the global average temperature change? • This is a fundamental question in climate dynamics, and is relevant to both past and future climate change.
Zero-Dimensional Model of Earth’s Climate • Consider a very simple model of Earth’s climate: a balance between incoming solar radiation and outgoing longwave radiation (i.e., thermal emission).
Zero-Dimensional Model of Earth’s Climate • Consider a very simple model of Earth’s climate: a balance between incoming solar radiation and outgoing longwave radiation (i.e., thermal emission). Net incomingsolar radiation Outgoing longwaveradiation
Zero-Dimensional Model of Earth’s Climate • We can write an expression for F↑ by assuming that Earth radiates as a blackbody and its temperature can be represented as a single value.
Zero-Dimensional Model of Earth’s Climate • We can write an expression for F↑ by assuming that Earth radiates as a blackbody and its temperature can be represented as a single value. Net incomingsolar radiation
Zero-Dimensional Model of Earth’s Climate • We can write an expression for F↑ by assuming that Earth radiates as a blackbody and its temperature can be represented as a single value. Net incomingsolar radiation Temperature
Zero-Dimensional Model of Earth’s Climate • We can write an expression for F↑ by assuming that Earth radiates as a blackbody and its temperature can be represented as a single value. Net incomingsolar radiation Stefan-Boltzmannconstant Temperature
Differentiating with respect to T: Rewriting in terms of dT/dSnet:
Expressing as finite differences and assuming that all perturbations to the global energy balance are equivalent: In this simple model, G0 is the gain of the climate system. For T = 255K,
DQ DT G0 Schematic Diagram ofZero-Dimensional Climate Model
DQ DT G0 Schematic Diagram ofZero-Dimensional Climate Model RadiativeForcing
DQ DT G0 Schematic Diagram ofZero-Dimensional Climate Model ThermalResponse RadiativeForcing
DQ DT G0 Schematic Diagram ofZero-Dimensional Climate Model ThermalResponse RadiativeForcing
Radiative Feedbacks • Some properties of the climate system affect the global radiation balance. • If these properties change as Earth warms or cools, they can lead to further changes in climate. • Such changes are called radiative feedbacks.
Radiative Feedbacks • What would happen to each of these climate system properties if the global mean temperature were to increase?
Snow-Ice-Albedo Feedback • In a warmer climate, snow cover and sea ice extent are reduced. • Reduced snow cover and sea ice extent decrease the surface albedo of the earth, allowing more solar radiation to be absorbed. • Increased absorption of solar radiation leads to a further increase in temperature. • This is a positive feedback.
Water Vapor Feedback • In a warmer climate, increases in saturation vapor pressure allow water vapor to increase. • Increased water vapor increases the infrared opacity of the atmosphere. • The reduction in outgoing longwave radiation leads to a further increase in temperature. • This is a positive feedback.
Lapse Rate Feedback • Moist convective processes control the vertical temperature distribution over much of the earth (i.e., tropics and much of summer hemisphere). • The moist adiabatic lapse rate is smaller in a warmer climate, thus temperature changes in the upper troposphere are greater than those at the surface. • Greater warming aloft increases the outgoing longwave radiation, thus cooling the atmosphere. • This is a negative feedback.
Cloud Feedback • Low clouds and high clouds affect the earth’s radiation balance differently. • Both cloud types reflect solar radiation, but only high clouds decrease infrared emission.
High clouds emit IR at very low temperatures Low clouds emit IR at temperatures similar to those of the surface
Cloud Feedback • Low clouds and high clouds affect the earth’s radiation balance differently. • Both cloud types reflect solar radiation, but only high clouds decrease infrared emission. • The net effect of low clouds is to cool the climate (reflect solar, but little effect on infrared). • The net effect of high clouds is to warm the climate (reflect some solar, strongly decrease infrared emission). • Sign of cloud feedback is uncertain because there is no simple relationship between cloud cover and global temperature and because of the interplay between the effects of high and low clouds.
DQ DT G0 Zero-Dimensional Climate Model With Feedbacks
DQ DT J G0 DJ F Zero-Dimensional Climate Model With Feedbacks
DQ DT J G0 DJ F Zero-Dimensional Climate Model With Feedbacks
Solving for DT: This can also be written as Larger positive F→ larger Gf→ larger DT
Very often, l is used in place of Gf : Less often, a different nomenclature is used: (This can be very confusing at times!)
Climate sensitivity is sometimes expressedin terms of the equilibrium warming that would result from a doubling of atmospheric CO2:
Simulated Climate Sensitivity • The equilibrium global warming to a doubling of CO2 (DT2xCO2) simulated by current climate models varies over a relatively wide range. • IPCC: 66% chance that DT2xCO2 lies within 2.0-4.5 K; 95% chance that it is >1.5 K.
Forcings vs. Feedbacks • When considering the real climate system, the distinction between forcings and feedbacks can sometimes be unclear. • Example: CO2 is regarded as an external forcing of future climate change, but natural, climate-dependent CO2 variations have occurred in Earth’s past.
Forcings vs. Feedbacks • Distinction depends on the definition of the climate system. • In a model framework, forcings and feedbacks can be distinguished more readily. • Forcing → process external to the system • Feedback → process internal to the system
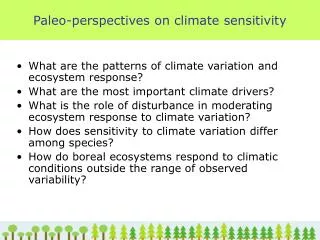
Fast vs. Slow Processes • When using paleoclimate information to evaluate climate sensitivity for application to decadal-to-centennial scale climate change, it is useful to distnguish between “fast” and “slow” processes. • Fast → time scales of years to decades • Slow → time scales of centuries or longer
watervapor clouds snow and sea ice
watervapor clouds snow and sea ice All of these processes are fast
Radiative Feedbacks Involving Slow Processes • Growth and decay of large continental ice sheets (albedo) • Climate-dependent changes in vegetation (albedo) • Biogeochemical changes in carbon cycle (atmospheric CO2, CH4) • Tectonics (many indirect effects)
Evaluating Climate Sensitivity • For evaluating climate sensitivity resulting from fast feedback processes (i.e., those most relevant to dec-cen climate change), external forcings and results of slow processes can be taken as inputs.
Evaluating Climate Sensitivity • For evaluating climate sensitivity resulting from fast feedback processes (i.e., those most relevant to dec-cen climate change), external forcings and results of slow processes can be taken as inputs. ice sheetdistribution atmosphericcomposition orbitalparameters sea level
Evaluating Climate Sensitivity • For evaluating climate sensitivity resulting from fast feedback processes (i.e., those most relevant to dec-cen climate change), external forcings and results of slow processes can be taken as inputs. ice sheetdistribution atmosphericcomposition orbitalparameters sea level
Evaluating Climate Sensitivity • For evaluating climate sensitivity resulting from fast feedback processes (i.e., those most relevant to dec-cen climate change), external forcings and results of slow processes can be taken as inputs. ice sheetdistribution atmosphericcomposition orbitalparameters sea level changes intemperature
Evaluating Climate Sensitivity • For evaluating climate sensitivity resulting from fast feedback processes (i.e., those most relevant to dec-cen climate change), external forcings and results of slow processes can be taken as inputs. ice sheetdistribution atmosphericcomposition orbitalparameters DQ sea level changes intemperature DT
Evaluating Climate Sensitivity Using “Paleocalibration” • Determine DQ and DT from paleodata. • Compute Gf (a.k.a. l) from DQ and DT. • Compare the “paleocalibrated” Gf value with model-derived or empirically derived estimates.
ice sheetdistribution atmosphericcomposition orbitalparameters DQ sea level changes intemperature DT
Evaluating Climate Sensitivity Using Paleoclimate Modeling • Determine required forcings (including those resulting from slow feedback processes). • Apply these forcings to climate model. • Compare resulting changes in temperature to those reconstructed from geological data.
ice sheetdistribution atmosphericcomposition orbitalparameters DQ sea level changes intemperature DT
“Paleocalibration” +Results are independent of climate models. +Results can easily be revised when new estimates of forcing or response become available. -Global mean temperature estimates are required. Paleoclimate Modeling +Global mean temperature estimates are not required. (More effective with good data coverage, though.) + Does not require the forcing-response relationship to be linear. + Provides additional insights beyond climate sensitivity. - Requires extensive computation with a climate model. Advantages and Disadvantages
Estimating Forcings: Orbital Parameters • Orbital parameters can be calculated accurately for millions of years based on orbital mechanics. • Results of such calculations are widely available.