Download
1 / 8
80 likes | 197 Vues
Understand cash flow diagrams and present value analysis to make informed financial decisions. Learn how to calculate future amounts and present costs using interest rates. Compare options using cash flow diagrams for equipment purchases or labor costs.

E N D
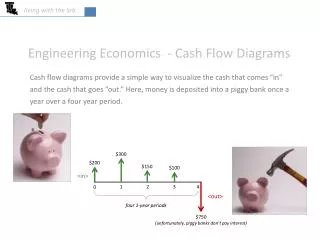
living with the lab Engineering Economics - Cash Flow Diagrams Cash flow diagrams provide a simple way to visualize the cash that comes “in” and the cash that goes “out.” Here, money is deposited into a piggy bank once a year over a four year period. $300 $200 $150 $100 <in> 2 3 4 1 0 <out> four 1-year periods $750 (unfortunately, piggy banks don’t pay interest)
living with the lab <in> versus <out> is a matter of perspective viewpoint of piggy bank viewpoint of your pocket $750 $300 <in> $200 $150 $100 0 1 2 3 4 <in> <out> 2 3 4 1 0 $100 $150 $200 <out> $300 $750
living with the lab Present Amount “P” and Future Amount “F” P = present amount (amount at t=0)F = future amount (equivalent future amount at t=n of any P at t=0) n = number of interest periods (usually months or years) i = interest rate Example: You deposit $10,000 in an account that earns an annual interest rate of 8%. How much will the account be worth in 10 years, assuming annual compounding? F = ? <in> 0 1 2 3 4 5 6 7 8 9 10 <out> $10,000
living with the lab Class Problem You would like to collect a lump sum of $5 million when you retire in 50 years when you retire. Assuming you can earn 10% interest (compounded annually), how much do you need to invest now? Before you begin, draw a cash flow diagram.
living with the lab Example: What if you have multiple <ins> or <outs> on one diagram? $1,000 $700 $500 $350 What is the “present amount” for the cash flow shown here, assuming an annual interest rate of 10% compounded annually? <in> 2 3 1 0 <out> P = ? Stated another way, if you were a lender and wanted to earn 10% on your money, then how much could you lend now <out> considering the payments you will receive <in> over the three year period? Bring each of the four payments back to the present: This is the amount you would need at t=0 to generate the cash flow shown, assuming 10% interest. $2,224.27
living with the lab Example continued: $1,000 $700 Now, reverse the previous problem. Here, think of yourself as depositing the money in an account that earns 10% interest (compounded annually). How much will the cash flow be worth at the end of three years? $500 $350 <in> 2 3 1 0 <out> F = ? HINT: Be careful on what values of “n” you use. APPLY REPEATEDLY The $700 draws interest zero years (you withdraw it the same day you deposit it).
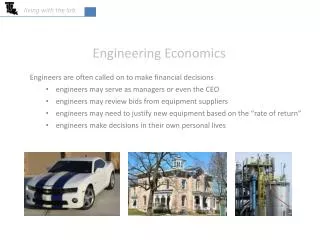
living with the lab • Class Problem • Your company has the option of purchasing a piece of equipment that • will lower labor costs OR continuing to pay your existing labor costs. • OPTION 1Continue paying existing labor costs, assuming $1,500 is paid out at the end of each year. • OPTION 2Purchase the new equipment to reduce labor costs: • The equipment costs $5,000. • The equipment is worth $3,000 at the end of 5 years (salvage value of the equipment). • Labor costs will be reduced from $1,500 per year down to $1,000 per year. • Assume that your money has the capacity to earn an annual interest rate of 10% compounded annually. • REQUIRED: • Draw a cash flow diagram for each case. • Evaluate the “present amount” (present cost) for each option. • Choose the best option by comparing the “present costs.” Be careful, since the present cost is really the amount of money that you would need up front to cover your expenses over the five year period.
living with the lab Solution