The Materials Life Cycle
The Materials Life Cycle. Life Cycle Assessment. LCA traces the cycle of materials and processes Documents resources consumed, emissions excreted. Life Cycle Assessment. Different levels are appropriate: Full LCA scrutinizing every aspect (tedious, expensive) A Sketch-like overview

The Materials Life Cycle
E N D
Presentation Transcript
Life Cycle Assessment • LCA traces the cycle of materials and processes • Documents resources consumed, emissions excreted
Life Cycle Assessment • Different levels are appropriate: • Full LCA scrutinizing every aspect (tedious, expensive) • A Sketch-like overview • Approximate • anything in between
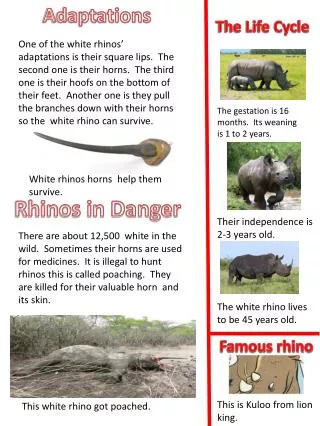
Energy Product Manufacture Feedstock Transportation Natural Resources Material Production Product Use Product Disposal Emissions: CO2, NOx, SOx Particulates Toxic waste Low grade heat
Emissions • There is a wide range of emissions: • Carbon dioxide, sulfur oxides, nitrous oxides, low grade heat, gas, liquid and solid waste • In low concentrations, most of these are harmless. But in high concentrations they can be damaging. • The sum of these unwanted by products often exceeds the capacity of the environment to handle them.
Emissions damage • If the damage is local and the responsible agent deals with the cost of containing and remediating, we say the environmental cost is internalized. • If the damage is global and the agent is not held responsible, the cost is spread over society and we say the environmental cost is externalized.
Which is greener? • Life-cycle analysis is a method in which the energy and raw material consumption, emissions and other factors are measured, analyzed and evaluated over the product’s entire life. • Life-Cycle Analysis attempts to measure the “cradle to grave” impact on the ecosystem.
LCAs started in the early 1970s, initially to investigate the energy requirements for different processes. • Emissions and raw materials were added later. • LCAs are considered to be the most comprehensive approach to assessing environmental impact.
cloth vs. disposable diapers • 1990 –The American Paper Institute finds disposable diapers to be preferable. • 1991 – The National Association of Diaper Services concludes the opposite. • 1992 – Procter & Gamble reverses the conclusion once more. • Each time, additional considerations were brought in: -indirect of paper production (increasing impacts of disposables) -production of detergents (increasing impacts of washing cloth) • 1992 – New study by Franklin Associates, concluding that the answer depends on whether one looks at energy or water or solid waste.
Franklin and Associates • Total energy used by each diaper type in one year. • Feedstock and process energy includes energy used through cotton growing, material processing and diaper manufacture. • It also includes energy used and embodied in bleach and detergent.
Franklin and Associates • Volume of solid waste per year. • includes waste used to produce the diaper such as raw material production and process, manufacture trimmings, and ash from electricity generation. • Post consumer waste refers to substances thrown out: the diaper itself, child waste, and packaging.
What is the conclusion? • Is energy or waste more important? • Other factors possibly involved as well • When conclusions are easily reversed, probably too close to call?
Methodologies • Initially, numerous variants of LCA “methods” were developed/investigated, but today there is consensus that there is only one basic method with a large number of variants • Currently IS0 14040-14043 is considered to be the LCA standard.
Four steps of LCA • 1. Goal definition (ISO 14040) • The basis and scope of the evaluation are defined. • 2. Inventory Analysis (ISO 14041) • Process tree for raw material to waste • Mass and energy balances are computed • All emissions and consumptions are accounted • 3. Impact Assessment (ISO 14042) • Emissions and consumptions are translated into environmental effects. • The environmental effects are grouped and weighted. • 4. Interpretation/Assessment (ISO 14043) • Areas for improvement are identified.
1. Goal definition • establish beforehand what purpose the model is to serve, what one wishes to study, what depth and degree of accuracy are required, and what will ultimately become the decision criteria. • In addition, the system boundaries - for both time and place - should be determined.
2. Inventory Analysis • inputs and outputs of all processes in terms of material and energy. • process tree showing events in a product’s life-cycle and their interrelations. • the emissions from each process and the resources (raw materials) used for each event • establish (correct) material and energy balance for each process stage and event.
Processes: Inputs: Raw Materials Energy Outputs: Atmospheric Emissions Waterborne Waste Solid Waste Co-Products Other Releases Raw Materials Acquisition Manufacturing Use / Re-use / Maintenance Recycling / Waste Mgmt. System Boundary
Problems with LCI • The inventory phase usually takes a great deal of time and effort and mistakes are easily made. • There is data on impact of different materials • the data is often inconsistent and not directly applicable due to different goals and scope. • hoped that the quantity and quality of data will improve in the future. • Results are generalized improperly.
3. Impact Assessment • The impact assessment focuses on characterizing the type and severity of environmental impact more specifically. • There are different ways to weight and assess impacts.
EPA 10 most wanted Measure: kg CO2 Equivalent kg CFC Equivalent kg NOX Equivalent H+ Moles Equivalent kg Nitrogen Equivalent kg Benzene Equivalent kg Toluene Equivalent kg: DALYs Equivalent kg 2,4-D Equivalent MJ Surplus/Extracted Energy Impact: Global Warming Potential (GWP) Ozone Depletion Potential (ODP) Photochemical Oxidant Potential (PCOP) Acidification Potential Eutrification Health Toxicity (Cancer) Health Toxicity (Non-Cancer) Health Toxicity (Air Pollutants) Eco-Toxicity Potential Fossil Fuel Use
Environmental effect Material/impact depletion of biotic resources copper CO2 CFC SO2 NOx Phosphorous VOCs heavy metals PCB pesticides styrene depletion of abiotic resources greenhouse effect ozone layer depletion acidification eutrophication (summer) smog human toxicity eco-toxicity odor
4. Interpretation • The final step in Life-Cycle Analysis is to identify areas for improvement. • Consult the original goal definition for the purpose of the analysis and the target group. • Life-cycle areas/processes/events with large impacts (i.e., high numerical values) are clearly the most obvious candidates • However, what are the resources required and risk involved? • Good areas of improvement are those where large improvements can be made with minimal (corporate) resource expenditure and low risk.
Paper or plastic? • Goal? • Inventory Analysis • Impact assessment • Analysis
Inventory • Materials: Paper and polyethylene + additives, colorants, etc. • Processes: film blow, paper forming, printing, etc. • 1.5 plastic bags = 1.0 paper bags • Waste water, green house gasses • Recycling? Composting? • How to account for human variability?
Plastic bags generate 39% less greenhouse gas emissions than uncomposted paper bags, and 68% less greenhouse gas emissions than composted paper bags. • Plastic bags consume less than 6% of the water needed to make paper bags • Plastic grocery bags consume 71% less energy during production than paper bags.
total non-renewable energy consumed in plastic bag life is 36% less than paper bags, and up to 64% less than that consumed by biodegradable plastic bags. • Using paper sacks generates almost five times more solid waste than using plastic bags. • After three uses, reusable plastic bags are superior to all other types of disposable bags
Manufacturing • Paper consumes twice as much water and emits about 60% more greenhouse gases than plastic. • biodegradable plastic bags generate higher levels of greenhouse gas emissions, atmospheric acidification and eutrophification