Water Balance Group
220 likes | 399 Vues
Water Balance Group. Russell Auwae Hannah Cooper Helder Da Costa Denise Duenas Abby Frazier James Frizzell Melissa Kahili. Introduction. Hawai‘i’s success is due to fresh water available from Orographic rainfall Water is the most important natural resource Health Economics Land Use

Water Balance Group
E N D
Presentation Transcript
Water Balance Group Russell Auwae Hannah Cooper Helder Da Costa Denise Duenas Abby Frazier James Frizzell Melissa Kahili
Introduction • Hawai‘i’s success is due to fresh water available from Orographic rainfall • Water is the most important natural resource • Health • Economics • Land Use • Sustenance
Objectives • Where does the water go in the Mānoa basin? • Ground Water Recharge • Evapotranspiration for Hydrologic Cycle • Human Impacts on Hydrologic Cycle • Ecosystem Analysis • Flood Analysis
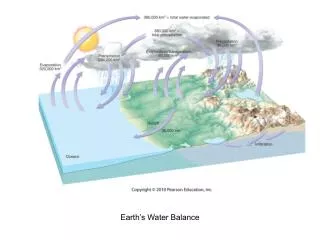
Water Balance Model • Text Description: • Water Balance = Hydrometeorology + Soil Physics + Groundwater Hydrology • Simple Water Balance Formula: • Input = Output + Storage • RF + Irr + CWI = RO + ET + GWR + SM
Water Balance Model • Rainfall • Potential Evapotranspiration • Irrigation • Run-off P Irr ET RO SM Rchg
Input Parameters • Available Water Capacity • Root Depth (mm) • Crop Factor • Initial Soil Moisture (AW/AWC) • Fraction of Area Paved (Amount of Land Cover Paved) • Irrigated Area (Irrigated or Not Irrigated)
Outputs • Actual Evapotranspiration • Soil Moisture Content • Groundwater Recharge
Evapotranspiration Average throughout Mānoa Valley *Total evapotranspiration: 171.9 mm
Evapotranspiration *Greatest amount of evapotranspiration occurs near Lyon Arboretum *Lowest values for found in the back of Mānoa Valley most likely due to low net radiation
How good is the water balance model when measuring Soil Moisture throughout Mānoa Valley?
Recharge *Highest amounts of recharge occur near the Lyon Arboretum *Lowest amounts of recharge found in Mānoa urban/residential areas
RECHARGESpatial Variation Grid 32: Total Rchg = 128.8mm Peak = 8.7mm in one hour Grid 13: Total Rchg = 436.9mm Peak = 18.4mm in one hour Grid 58: Total Rchg = 21.9mm Peak = 2.07mm in one hour Grid 47: Total Rchg = 272.6mm Peak = 13.15mm in one hour
*About half of the total recharge was produced in the last 22 days of the study *Total recharge produced: 258.8 mm
Water Balance in the Mānoa Basin Run-Off Storage
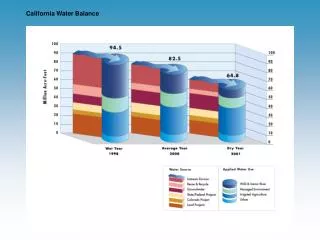
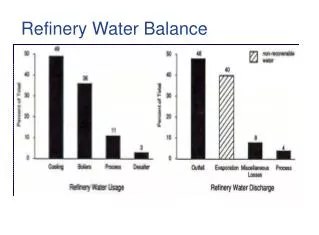
Water Balance Results • Where the water went in the Mānoa Basin: Input: 708.9 mm / 10,997,895 m3 Output: 709.6 mm / 11,008,754.82 m3
Summary • Where the water went in the Mānoa Basin: Input: 708.9 mm / 10,997,895 m3 Output: 709.6 mm / 11,008,754.82 m3 93.8% 6.2% 24.2% RF + Irr = RO + ET + GWR + SM 36.5% 3.2% 36.1%