Download
1 / 17
210 likes | 514 Vues
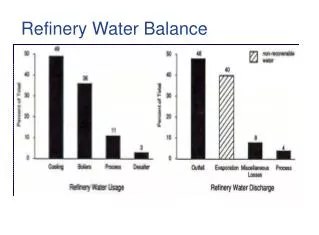
Refinery Water Balance. Thumbnail Sketch of Return On Investment for Sour Water Capture. Where Applicable : Any Distillation Column Overhead Water Accumulator. Estimated Equipment Capital Investment : ~ $800 K. Return on Investment via Realized Reductions in O&M costs : ~ 18 Months.

E N D
Thumbnail Sketch of Return On Investment for Sour Water Capture • Where Applicable: Any Distillation Column Overhead Water Accumulator. • Estimated Equipment Capital Investment: ~ $800 K. • Return on Investment via Realized Reductions in O&M costs: ~ 18 Months. • Ongoing O&M Cost: < $0.10 per 1000 gallons. Refinery Water Engineering & Associates
Benefits of Capturing Sour Water For High Quality Process Supply Water • Removes considerable contaminant loads to wastewater plant, thus reducing central wastewater plant O&M costs. • Provides steam condensate quality boiler feedwater. • Resulting supply water does not need pretreatment for boiler feedwater, such as Ion Exchange or Reverse Osmosis, thus reducing pretreatment costs. • Recovers considerable lost heat in wastewater and reuses to preheat boiler feedwater, thus saving considerable money in lost BTUs and fuel costs. • Greatly reduces Boiler Water chemical and blowdown costs by increasing permissable Cycles of Concentration. Refinery Water Engineering & Associates
Impact of feedwater quality on boiler operational efficiency 50 cycles versus 10 cycles saves $300,000/yr 50 cycles versus 10 cycles saves $120,000/yr 50 cycles versus 10 cycles saves $10,000/yr
Project: Cost of Steam LeaksCan we find 10 leaks? $2MM Savings
Deployment of biokinetic modeling tools to optimize real time biological wastewater process control in the oil refining industry Environmental Expert Magazine Article By Dave Kujawski; Arthur WongCourtesy of Refinery Water Engineering & Associates (RWE) Jan. 15, 2010 • http://www.environmental-expert.com/resultEachArticle.aspx?cid=37921&codi=78871&level=0 Processing Magazine Article • http://www.waterwasteproc-digital.com/wwprocessing/201002#pg6 Full Version Article w/Data • http://refinerywater.zoomshare.com/2.html Refinery Water Engineering & Associates