Download
1 / 20
530 likes | 1.55k Vues
WILDLIFE MONITORING. Greg Stuart-Hill World Wildlife Fund. This focuses on wildlife (fauna) monitoring. Other natural resource monitoring systems (e.g. veld, fish, forestry) are also important. Are objectives being achieved?. Set objectives (land-use planning).

E N D
WILDLIFE MONITORING Greg Stuart-Hill World Wildlife Fund This focuses on wildlife (fauna) monitoring. Other natural resource monitoring systems (e.g. veld, fish, forestry) are also important
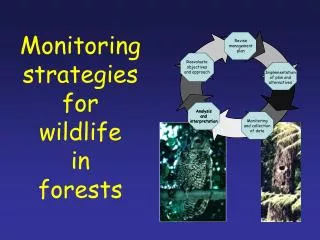
Are objectives being achieved? Set objectives (land-use planning) Manage according to objectives Yes Monitor to see if objectives being achieved No Modify objectives or management Monitoring is needed for adaptive management The context:
What should be monitored? Introductions Removals Trophy Quality Tourism Satisfaction Water Anti-poaching work MANAGEMENT & USE Population Estimate Population Trend Animal Distribution Sex/Age --------- WILDLIFE ------------ (All species) Body Condition Population Ecol IMPACTS Problem Animals Poaching Mortality Rainfall Disturbance (Important species)
1.1 Population Estimates • Need: To know how many animals there are, each year. • Why? • To estimate off-take quotas, and • To determine drought risk & livestock competition • How? • Use road counts/aerial census/cybertracker counts • Use correction-factors (eg transect width, distance, etc) • For rare species (eg rhino) use known group/individuals Datasheet: • Output: ……..a Table for each year! • Numbers are very difficult to obtain • – most census methods underestimate wildlife populations!
Great! Zebra Here’s a problem! Kudu Years Years 1.2 Population Trend Need: to know what is happening to the wildlife populations. Why? Is wildlife management sustainable How?Fixed Foot Patrols, fixed road counts, Cybertracker Counts and Aerial census. Can use an index! ….... But sampling effort must be controlled ! ….. Datasheet: Output: …provide a graph for each species! Counts do not have to be ‘accurate’ – a change in an index over time is fine! Be careful of using the last point on the graph – this could be an error - so check the sex-ageinformation
Lets build a lodge here because this is where most of the game is Why not put a borehole here to utilize this area Year 1 Year 10 1.3 Game Distribution Need a Map showing where each species is concentrated Why? To identify wildlife concentration areas for land-use planning purposes (also to see monitor distribution changes over the years) How? Use Cyber tracker or Grid blocks for all sightings (NB also record where animals were not seen) Data collection: Output: Land use planning Monitoring
1.4 Sex-Age Ratio Monitoring Need to determine ratios between adults, sub-adults an juveniles Why? Use this information as an early warning of the current ‘health’ of the wildlife population Datasheet: Output: • Young: Adult Ratio • If the ratio of young to adults diminishes then this is an early warning that the population is in trouble • If the ratio between sub-adults and juveniles changes this gives an indication of post breeding survival ability – i.e. useful to evaluate impact of predation • Male : Female Ratio • It is necessary to know the ratio of Adult male to female because: • Live game capture/sale normally results in higher proportions of females - with potentially devastating impacts to the population • To properly evaluate breeding success, you need to view number of young in relation to the number of females • For input into population modeling which is used to predict population growth and future harvest potential and stocking rates
If sudden Increase What is going on here? What is causing these abnormally high mortalities? Mortality Years Output 2:Map showing where mortalities are Map: Showing mortalities Need: To keep track of mortalities Why? To alert management if mortalities suddenly rise & plan action based on the cause (e.g. poaching, disease, drought) 2.1 Mortalities Datasheet: Output 1:a Trend graph of mortalities over years Also need to know the cause of mortalities (i.e. is it due to poaching, disease, drought?) But only if they these are abnormally high
2.2 Poaching Poaching is getting bad! Poaching Years CATEGORY Cases Meat Commercial Residents 2 1 kudu, 1 duiker - Neighbors 10 8 kudu, 1 giraffe - Map: Showing where poaching is occurring Other Citizens 2 1 kudu 1 leopard A Table breaking down incidents for each year Non-citizens 1 elephant, 1 rhino Need: To track poaching as a threat to wildlife Why? To understand the threat to wildlife and gauge community support for the Conservancy Datasheet: Output: • Graph - is poaching being controlled? • Map - where poaching is taking place? • Table - who is poaching & what is being taken? If Increasing
2.3 Problem Animals (PAC) Need: To track problem animal incidents, identify those species causing problems, evaluate damage caused & record efforts that go into reducing conflict with problem animals Why? To understand the impact of wildlife on people & find ways to reduce conflict and compensate individuals. How? Keep record of all PAC incidents. Track attempts to reduce conflict (e.g. fencing, water protection, kraaling). Datasheet: • Output:
2.4 Rainfall Its been a good season! Years Map: Showing where rainfall occurred Need: To track rainfall as a threat & opportunity for wildlife Why? To separate the effects of rainfall from the impacts of human activity on wildlife and help explain population trend Datasheet: Output: • A Graph – is rainfall above or below average? • A Map - where did rain fall or not fall?
2.5 Disturbance (e.g. livestock, cropping, tourists) Disturbance is affecting the elephants Need: To track other land-use activities such as cropping, livestock farming, tourist activity Why? To understand the threat of these disturbances and gauge if these have impacted on wildlife • Data Collection: • Map areas of cropping and livestock farming • Map areas of tourism activity and keep track of tourism numbers on various roads • Record ‘flight’ distance (at what distance does game raun away from a vehicle) of game on an annual basis • Record how far wildlife will come within a homestead • Keep a note if animals only drink at night Output: • Graph - Relate an index of disturbance (e.g. ‘flight distance’ to indices of human impacts (e.g. settlement, tourism, etc). • Map - Also compare wildlife distribution maps with maps of human activity.
3.1 Game Introductions & Removals Need: To keep a record of how many animals are Introduced or Removed Why? To know if continued Introductions/Removals are wise, & explain any changes in the population trend-graphs How? Keep a record of all animals that are Introduced and all animals that are Removed from the area. • Output: ………..a Table for each year! ** Need to also check on success of each introduction • Also refer to the following pages in this manual for: • Game Removals • Game introductions • These pages will explain in greater detail the ‘Removal’ and ‘Introduction’ monitoring systems
3.1.1 Game Removals (“Harvesting”) • How? • Each time animals are removed (sold or hunted) keep a record of: • how many animals are removed against quota • sex of removed animals • for animals hunted, record trophies • Output: …..a Table for each year! • (see ‘TrophyQuality’ in the manual)
OK! OK! If Survival Rates are less than 90% for a species then a mortality report should be attached to the table If Breeding Rates are less than a critical level (level varies per species) then this indicates that a species will not thrive even though it survived survived the introduction event 3.1.2 Game Introductions • How? • 1. Keep a record of how many animals are introduced • 2. Also check on the success (i.e. survival & breeding) of each introduction by : • Conducting sex-age survey to determine ratios between adult females and young (see ‘sex-age monitoring’ in this manual) • Monitor marked (collared) animals to determine survival rates and ensure they are still in the area. • Output: …Distribution map and a Table
Permit# Species Sex Trophy (L) Trophy (R) Client PH Lower the elephant quota! - we have taken too many. Hunters can only find small tuskers Tusk Size Years 3.2 Trophy Quality Need: to track change in Trophy Quality (e.g. tusk/horn size) Why? Trophy hunting will not affect wildlife population growth (excluding predators), but too much hunting results in poor trophy size - this leads to a lower concession value. How? From trophy hunter records Datasheet: Output: …provide a trophy size trend graph for each species, over years!
Species Sighting index Comments of sighting satisfaction per species We should re-introduce lions - they are key to tourism and are not being seen anymore If we reduce elephant numbers it will save us a lot of damage and have no effect on game viewing Lion Elephant Years Years • Need to track game viewing success (i.e. number of sightings, number of species, etc). • Why? • know game viewing potential for planing & marketing, • to evaluate whether each animal population is at adequate numbers to satisfy tourists. • to assess whether a problem species could be reduced without harming game viewing 3.3 Tourist Satisfaction Datasheet: Output: … provide a ‘game viewing success’ graph for each species, over years!
Bore # Locality Date Protection against Presently working? Comments, including repairs if any Damage by? Elephant Theft Datasheets: 3.4 Water Points Need: to closely monitor and repair any water installation, particularly in the dry season. Why? Water is critical to wildlife, people and livestock. There is considerable conflict around this resource and so it is essential to ensure that water installations function. How? Each water point should be visited on a regular basis and if necessary repairs made immediately.
Rhino inter-calving period is suddenly increasing. There seems to be a problem ? Months between calves Years 4.1 Important Species: Population Performance Need: To to track population performance of species such as predators, elephant, rhino, disease free buffalo, etc Why? To know how many there are and how their populations are performing. How? Normal count methods do not work for rare or nocturnal species. Use specially designed systems (e.g. radio tracking, known group). This usually involves specialist research teams from MET, SRT, etc. Output:
Lets provide extra feed for the buffalo! I foresee problems this winter Body Fat Years 4.2 Important Species: Body-Condition Need: To track body condition of critical species such as Rhino, disease free Buffalo, Roan, etc Why? To serve as an early warning of a nutritional (drought) problem. How? Estimate body fat on a sample of animals each month and graph. Output: