Download

1 / 48
510 likes | 799 Vues
Quantification of mineral admixtures on cement by Rietveld method. Luciano Gobbo, PhD, Geosciences Intitute - USP Luciano.gobbo@panalytical.com. X ray Diffraction. Bragg’s law: n = 2d sin . Difractogram. 100 % intensity. Angular positions. Relative intensities. Crystalline.

E N D
Quantification of mineral admixtures on cement by Rietveld method Luciano Gobbo, PhD, Geosciences Intitute - USP Luciano.gobbo@panalytical.com
X ray Diffraction Bragg’s law: n=2dsin
Difractogram 100 % intensity Angular positions Relative intensities
Crystalline Amorphous
XRD Why XRD? • Mechanical properties and performance characteristics of clinkers and cements are primarily determined by: • structure, • composition, and • distribution of crystalline (mineral) phases… • Alite • Belite • C3A • C4AF • CaO • MgO • ... ….not elemental concentration.
Clinker quantification • Bogue Method • Microscopy • XRD - Rietveld
Bogue • Developed in 1929 4 Elements (adapted later) • Alite3-4% substituent's - Na+, K+, Mg2+, Fe3+ (Ca2+) • - Al3+, P5+, S6+ (Si4+) • Belite 6% substituent's – K+, Na+, Mg2+ (Ca2+) • - Fe3+, Al3+, P5+, S6+ (Si4+) • Ferrite 10% substituent's – Mg2+, Si4+
XRD • Fast • Reproducible • Possible to quantify Types of Alite, Belite • Cubic and Orthorhombic C3A • Alkaline sulphates • Periclase, Free lime, Ca(OH)2
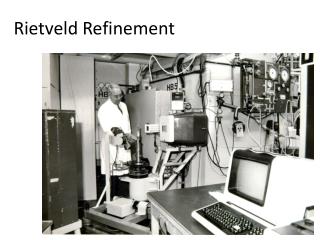
XRD – Rietveld Method Rietveld (1969) developed a means to refinecrystal structure information for powder (neutron) diffraction data by: • Using ‘initial’ crystal structures and • Minimizing the differences between calculated and measured profiles using a least squares approach with many variables for each phase. Dr Hugo Rietveld – Halle, Germany (2009)
The Rietveld method is the best practical way to quantify the phases in clinker/cement XRD – Rietveld Method The Rietveld method uses all peaks and the complete profile for the analysis: For each phase present a diffraction pattern is calculated For all phases a total pattern is generated The difference between observed and calculated patterns is minimized by varying parameters in the model through a least squares process Quantitative analysis of clinker and cement: Rietveld
XRD – Rietveld Method 1st Step – Data collection 2nd Step – Calculated pattern insertion 3rd Step – Start Refinement of each parameter (scale factor, zero shift, unit cell, profile (Gauss/Lorenz), assimetry, prefered orientation...)
XRD – Rietveld Method 1st Step – Data Collection 2nd Step – Calculated diffractogram insertion 3rdStep – Start Refinement of each parameter (scale factor, zero shift, unit cell, profile (Gauss/Lorenz), assimetry, prefered orientation...)
Phase A Phase B Phase A = 64% Phase A Phase B = 36% Phase B XRD – Rietveld Method Calculated area + corrections = phase amount
XRD – Rietveld Method Final Result
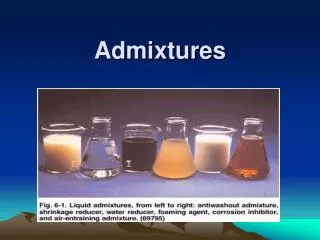
Metodology Cements prepared in laboratory with known amounts of: gypsum: 3, 6 and 9% limestone: 2, 5, 8, 10 and 12% fly ash: 10, 20, 30, 40, 50 and 60% slag: 20, 40 and 60%
Selected Fly ash Bottom Ash Fly ash
Selected Slag Acid Slag Basic Slag
Empyrean diffractometer used in the data collection (Panalytical) • 10-70 ˚2θ • 5 min • Cu anode - Rietveld quantitative analysis with High Score Software from Panalytical
LiF Calcite Cement + Fly ash Cement + 10-60% Fly ash
Slag variation LiF Cement + 10-60% Slag
100 90 80 70 60 50 40 30 30 40 50 60 70 80 90 100 Amorphous error Mixtures of crystalline and amorphous phases Every mixture was prepared and measured ten times amorphous portion calculated (wt.-%) 1:1 +/-2.0% error glass expected weight (wt.-%) Blended cements:amorphous and crystalline to ±2 wt%
Phases error • Alite 65 wt.-% ± 2 wt.-% • Belite 15 wt.-% ± 1.5 wt.-% • Ferrite 6 wt.-% ± 0.6 wt.-% • Aluminate 5 wt.-% ± 0.6 wt.-% • Lime 1 wt.-% ± 0.3 wt.-% • Periclase 1 wt.-% ± 0.3 wt.-% • Gypsum 2 wt.-% ± 0.4 wt.-% • Hemihydrate 1 wt.-% ± 0.3 wt.-% • Anhydrite 1 wt.-% ± 0.3 wt.-% • Calcite 1 wt.-% ± 0.3 wt.-% • Portlandite 1 wt.-% ± 0.3 wt.-% • Quartz 1 wt.-% ± 0.3 wt.-%
Sample preparation Why/When? Oriented Randomly • Pressing • Flat crystals • Alite • Gypsum • Portlandite (002) • Clay minerals (002) • Mullite
Sample preparation Common to gypsum Alite 15s 30s 60s 120 s 180 s
Conclusion • % of all clinker phases (different types of C3A and alkaline sulphates) • Quantification of amorphous in cement – useful cements with pozzolanic materials XRD-Rietveld analysis is a fast and reproducible method • Higher correlation with cement between quantitative results and cement properties
Thank you! Gracias!Questions: luciano.gobbo@panalytical.com