Download
1 / 4
40 likes | 163 Vues
The HFIP Diagnostic Activities and Plans TCMT focus on collecting and archiving Tier 1 and Tier 2 datasets essential for hurricane forecasting. This includes data processing, accessibility through the TCMT/HFIP website, and the JNT RAMADDA Data Repository, ensuring integration with visualization tools. The planned evaluations range from model performance assessments to real-time tracking and intensity plotting, coordinated with the NHC. Various model configurations and statistical methods are utilized to optimize forecasting effectiveness for the 2012 hurricane season.

E N D
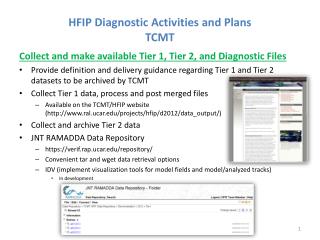
HFIP Diagnostic Activities and Plans TCMT Collect and make available Tier 1, Tier 2, and Diagnostic Files • Provide definition and delivery guidance regarding Tier 1 and Tier 2 datasets to be archived by TCMT • Collect Tier 1 data, process and post merged files • Available on the TCMT/HFIP website (http://www.ral.ucar.edu/projects/hfip/d2012/data_output/) • Collect and archive Tier 2 data • JNT RAMADDA Data Repository • https://verif.rap.ucar.edu/repository/ • Convenient tar and wget data retrieval options • IDV (implement visualization tools for model fields and model/analyzed tracks) • In development
HFIP Diagnostic Activities and Plans TCMT 2012 Retrospective Planning, Testing, and Evaluation • Coordinated with NHC and prospective Stream 1.5 modelinggroups • Activities coordinated with NHC • Baselines (top-flight models and impact on consensus) • Early model conversion (interpolator) • Groups provided input on flexible intensity adjustment settings • Evaluated configurations from eight modeling groups • Model types included regional, global, deterministic, ensemble, early, late, statistical, dynamical, correlation-based consensus • All but one candidate were selected by NHC as having some Stream 1.5 application for 2012
HFIP Diagnostic Activities and Plans TCMT 2012 Retrospective Testing: Methods for Displaying Results • Mean errors with confidence intervals • Percent of cases for which error differences exceed a specified threshold • Boxplots • Summary tables • Rankings line plots Track - ECMWF, GFS, GFDL Intensity - LGEM, DSHP, GFDL http://www.ral.ucar.edu/projects/hfip/h2012/verify/
HFIP Diagnostic Activities and PlansTCMT 2012 HFIP Demonstration • Real-time track and intensity plots • Track: basin and storm-scale domains, 90th percentile ellipse plots • Case study and full sample evaluations • Stream 1, 1.5, 2, plus combinations • Development of storm and up-to-date season model performance verification • Development of diagnostic evaluation tools to compare model errors as a function of environmental conditions • Development of ensemble evaluation methods