Download
1 / 17
170 likes | 306 Vues
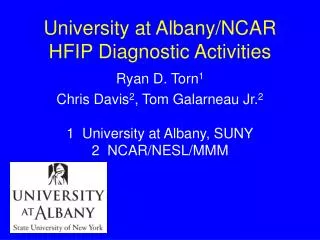
University at Albany/NCAR HFIP Diagnostic Activities. Ryan D. Torn 1 Chris Davis 2 , Tom Galarneau Jr. 2 1 University at Albany, SUNY 2 NCAR/NESL/MMM. Relevant Tasks:.

E N D
University at Albany/NCAR HFIP Diagnostic Activities Ryan D. Torn1 Chris Davis2, Tom Galarneau Jr.2 1 University at Albany, SUNY 2 NCAR/NESL/MMM
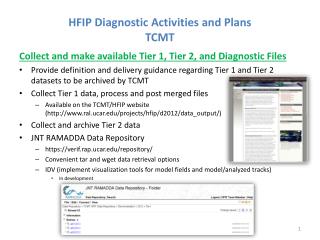
Relevant Tasks: • Vortex and convective scale analysis of HWRF, including comparison with Doppler radar and GPS dropsondes, and histogram analysis of HWRF and AHW • Expand upon ensemble-based sensitivity analysis of select Stream 1.5 cases to diagnose initial condition errors and suggest locations for targeted observations, and develop new tools for AHW ensemble variance growth • Verification of Environmental Parameters from HFIP diagnostic files using Stream 1.5 AHW and HWRF data. Transmit to EMC when completed.
Histogram and Obs. Verification • Goal is to stratify data by location, intensity, etc. to understand persistent biases in a model. • Examples with HWRF and AHW follow
Histogram Verification HWRF 2011 vs. HWRF 2012 Performance, 72 hour forecast H212 has less probability of having an erroneous recurvature
Histogram Verification HWRF 2011 vs. HWRF 2012 Performance, 72 hour forecast
Observation Verification Biases vs. 700 hPa Satellite Winds 700 hPa Radiosonde q 6 h AHW forecast biases during Sept. 2010 (Stream 1.5 testing)
Initial Condition Sensitivity • Goal is to understand how forecast errors in metrics that measure intensity are related to errors in the initial conditions or environment. • Ultimately leads to better understanding of model, tropical cyclones themselves, and can suggest new observation sampling strategies • Demonstrated using lower-resolution version of AHW during PREDICT
0 h Vortex EOFs Torn and Cook (2012), MWR In Press
Vortex vs. Environment Torn and Cook (2012), MWR In Press
Extension to Higher Resolution • Currently, these methods are being applied to higher resolution AHW forecasts of TCs • First looking at a forecast of Igor prior to RI, which is characterized by similar intensity evolutions, but very different internal structures
Igor Eyewall Replacement Member 30 Member 35 AHW forecast of 3 km condenstational heating rate initialized 0000 UTC 11 Sept. 2010
Vortex Comparisons Difference in water vapor mixing ratio between ensemble members with eyewall replacement and those without (shading) 48 h Forecast
Diagnosing Forecast Errors in Tropical Cyclone Motion Verror • New method for computing steering layer flow and diagnosing TC motion errors in any NWP model • Allows quantification of the intersection between TC structure and position errors 6 9 Vobs Vmodel AHW TC Earl (2010) Track Forecasts Slow, right of track error in AHW Motion error = Environment wind error + near-storm vorticity asymmetry error + steering depth error +residual 24-h AHW Forecast TC Earl (2010) Motion Error Diagnosis Error attributed to persistent eastward environment wind error; other terms are large at individual times 1.0 m/s Ref: Galarneau and Davis (2012), MWR, in press
venv Error for AHW 24-h Forecast verifying at 0000 UTC 27 Aug • venv error in conjunction with weak subtropical ridge in AHW 600 mb Z and Z error (AHW–CFSR) 850–450 mb venv error (AHW–CFSR) x x v00Z/27
Environment Verification • Goal is to produce histograms of position/intensity errors against errors in environmental parameters • Provides possible explanation for forecast errors, area of model to target for improvement • Not much progress on this front so far, will begin shortly
Preliminary Future Plans • Continue with initial condition sensitivity evaluation (17 cases from this year’s Stream 1.5 testing) • Develop diagnostic histogram program • Collaborations welcome…