Download
1 / 30
300 likes | 477 Vues
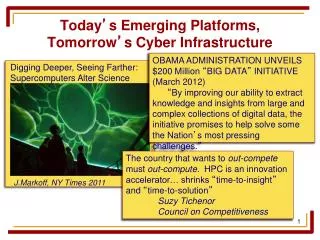
Today ’ s Emerging Platforms, Tomorrow ’ s Cyber Infrastructure. OBAMA ADMINISTRATION UNVEILS $200 Million “ BIG DATA †INITIATIVE (March 2012)

E N D
Today’s Emerging Platforms,Tomorrow’s Cyber Infrastructure OBAMA ADMINISTRATION UNVEILS $200 Million “BIG DATA” INITIATIVE (March 2012) “By improving our ability to extract knowledge and insights from large and complex collections of digital data, the initiative promises to help solve some the Nation’s most pressing challenges.” Digging Deeper, Seeing Farther: Supercomputers Alter Science The country that wants to out-compete must out-compute. HPC is an innovation accelerator… shrinks “time-to-insight” and “time-to-solution” Suzy Tichenor Council on Competitiveness J.Markoff, NY Times 2011
Future computing platforms (FCP) include accelerators like Field Programmable Gate Arrays (FPGAs) and General Purpose Graphics Processing Units (GPGPUs), multi -core and -threaded processors Cloud computing platforms FCP provide better energy efficiency performance accessibility Future Computing Platforms Progress in Algorithms Beats Moore’s Law: “performance gains due to improvements in algorithms have vastly exceeded even the dramatic performance gains due to increased processor speed.” Dec 2010 REPORT TO THE PRESIDENT AND CONGRESS by the President’s Council of Advisors on Science and Technology
Limitations of a single processor • Microprocessor Power Density Growth • If scaling continues at present (2001) pace, • by 2005, high speed processors would have power density of nuclear reactor • by 2010, a rocket nozzle • by 2015, surface of sun • “Business as usual will not work in the future.” • Intel VP Patrick Gelsinger • (ISSCC 2001) Speed and power not keeping pace
Multi-core Processors A problem is broken into discrete parts that can be solved concurrently Instructions from each part execute simultaneously on different CPUs Each part is further broken down to a series of instructions Blaise Barney, Lawrence Livermore National Laboratory
Graphics Processing Unit (GPU) Co-processors GPUs are going beyond games and into general high throughput computing GPUs are low-cost accelerators tuned to highly data-parallel fine-grained tasks GPUs require rewriting code and may perform poorly on very irregular tasks or tasks with large sequential parts GPUs are speeding up a variety of image, biological sequence, graph, and string processing computations
FPGA Abstraction FPGA consists of Matrix of programmable logic cells Implement any logic function AND, OR, NOT, etc Can also implement storage Registers or small SRAMs Groups of cells make up higherlevel structures Adders, multipliers, etc. Programmable interconnects Connect the logic cells to one another Embedded features ASICs within the FPGA fabric for specific functions Hardware multipliers, dedicated memory, microprocessors FPGAs are SRAM-based Configure device by writing to configuration memory Logic Cells Interconnects
FPGA Device Trend + SSI Technology + ~70 Mbit on-chip 2M + 600 MHz 1.0V core 28 nm + 6-input LUT + 550 MHz 250K 1.0V core 40 nm + Integrated MAC + 500 MHz 200K 1.0V core 65 nm + PowerPC cores 1.2V core 100K 90 nm Logic Cells* + Embedded multipliers 1.5V core 0.13µ + Embedded RAMS 1.5V core 50K 0.13µ Configurable Logic Blocks 20K 1.8-2.5V core XC4000 7.5K 0.18-0.22µ 2.5-3.3V core 0.25-0.35µ 2009 2011 1997 1998 1999 2000 2001 2002 2005 2006 *Logic cell = LUT + FF + connection to adjacent cells
Example: Virtex 7 capabilities • On Chip BRAM bandwidth • 1292 x 36 Kbit BRAM blocks • BRAM bandwidth: 1292 x 36 x 500 MHz = ~23 Tbps • Distributed memory bandwidth • Total of 21 Mbits • For a 1K x 36-bit configuration ~600 blocks • Dist. memory bandwidth: 600 x 36 x 500 MHz = ~11 Tbps • Logic operation capabilities • Total possible inputs: 1220K x 6 inputs/ 6 = 1220K • Logic operations: 1220K x 500 MHz = 610 GOPs/s • Input/Output pins • Number of I/O pins: 1200 • Total I/O bandwidth: 1200 x 500 MHz = 600 Gbps
Cloud Computing • Scientific Software • (as a Service) • Traditional Software • Platform • (as a Service) • Infrastructure • (as a Service) • You manage Apps Apps Apps Apps • You manage • Managed by vendor Data Data Data Data • You manage • Managed by vendor Middleware Middleware Middleware Middleware O/S O/S O/S O/S • Managed by vendor Virtualization Virtualization Virtualization Virtualization Servers Servers Servers Servers Storage Storage Storage Storage Networking Networking Networking Networking Manageability » On-demand resources »“Pay as you go”» Simple services » Reduce time to science 9 Windows Azure Training Kit - January Refresh
Cloud Computing Data & compute collocated. Ease of data sharing & collaboration. Well suited for loosely coupled distributed applications on 100s of VMs Data parallel frameworks (e.g. Hadoop, Pregel, Workflows) Science applications: genome sequencing pipelines, graph analytics, 10
FCP Vision data-intensive grand challenge problems accelerated applications and analyses Center for Sustainable Software on Future Computing Platforms Graph Algorithms, Tools, Libraries, Frameworks Multi-core GPGPU FPGA Cloud
Graphs are pervasive in large-scale data analysis • Sources of massive data: petascale simulations, experimental devices, the Internet, scientific applications. • New challenges for analysis: data sizes, heterogeneity, uncertainty, data quality. Social Informatics Problem: Discover emergent communities, model spread of information. Challenges: new analytics routines, uncertainty in data. Graph problems: clustering, shortest paths, flows. Cybersecurity Problem: Detecting anomalies and bad actors Challenges: scale, real-time Graph problems: belief propagation, path and community analysis Bioinformatics Problem: Genome and haplotype assembly Challenges: data quality Graph problems: Eulerian paths, MaxCut Image sources: (1) Mihai Pop, Carl Kingsford www.cbcb.umd.edu/ (2) Chau et al. In SIAM Data Mining (2011) (3) www.visualComplexity.com
Next Generation Sequencing (NGS) enabled applications High-throughput DNA sequencing, or Next Generation Sequencing (NGS) technologies are used in a variety of applications • resequencing genome mapping • de novo sequencing genome assembly • gene expression analysis transcriptome assembly • metagenomic sampling metagenomic clustering and/or assembly In each case, longer original sequences must be recovered from the ~100 bp fragments produced by NGS
Example NGS-enabled Application: Genome Assembly Nature Biotechnology 29, 987–991 (2011)
Example NGS Enabled Application: Haplotype Assembly • Human genome contains a pair of DNA sequences : one from each parent called haploid sequences or haplotypes • Haplotypes differ at SNP positions • SNPs (single nucleotide polymorphism) are single basepair mutations (~0.1%; non-uniform) • SNP positions are “well known”, and contain one of two possible alleles • Haplotypes useful for disease prediction, organ transplant, drug response…next-gen sequencing. • Goal of phasing (haplotype assembly)is to use aligned sequence fragments to reconstruct the two haplotypes
Haplotype Assembly from Next-Gen Sequencing (NGS) Data From: An MCMC algorithm for haplotype assembly from whole-genome sequence data, V. Bansal, et al, Genome Res., 2008 18: 1336-1346
Haplotype assembly algorithm from UCSD • Construct consensus sequence consistent with NGS reads • Convert consensus & reads to binary • Assume consensus is a haplotype. Map to binary. • Convert sequence reads to binary • Convert consensus & reads to graph • SNP positions are nodes • Edges between nodes in the same read • Edge weight = Σ (edges inconsistent with haplotype or compliment) minus Σ ( edge consistent with haplotype or compliment)
Map Reads to Graph Pos. Note: Switch signs of edge weights An MCMC algorithm for haplotype assembly from whole-genome sequence data, V. Bansal, et al, Genome Res., 2008 18: 1336-1346
Phasing using HapCUT • Phasing is done by finding the graph MaxCut • Partition graph into two such that edge weights between the two partitions is max • MaxCut determines the reads with the “weakest” link to haplotype • Flip the binary digit of the haplotype at the MaxCut edges • Nudging the haplotype to be consistent with one of the partitions & hence the reads • Rebuild graph and repeat HapCUT: an efficient and accurate algorithm for the haplotype assembly problem Bansal and Bafna, Bioinformatics (2008), 24 (16): 153-159
Graph analytics for secure and trustworthy computing Monitoring and securing cyberspace involves many challenging connectivity-analysis problems • Identifying bad actors in a social network → community detection, betweenness centrality • Detecting malware → graph analytics + machine learning • Diagnosing connectivity problems in a computer network → path analysis • Modeling influence propagation → graph diffusion These problems may all involve “internet scale” and beyond — e.g., many billions of entities, trillions of relational edges A specific growth area is combining graph analytics and machine learning
Example: Malware detection The Polonium system combines graph analysis and machine learning to detect malware. → Chau et al. “Polonium: Tera-scale graph mining and inference for malware detection.” In SIAM Data Mining (2011).
Driving Forces in Social Network Analysis • Facebook has more than 1 billion active users • Note the graph is changing as well as growing. • What are this graph's properties? How do they change? • Traditional graph partitioning often fails: • Topology: Interaction graph is low-diameter, and has no good separators • Irregularity: Communities are not uniform in size • Overlap: individuals are members of one or more communities • Sample queries: • Allegiance switching: identify entities that switch communities. • Community structure: identify the genesis and dissipation of communities • Phase change: identify significant change in the network structure 3 orders of magnitude growth in 3 years!
Graph –theoretic problems in social networks • Community identification: clustering • Targeted advertising: centrality • Information spreading: modeling Image Source: Nexus (Facebook application)
Graph Analytics for Social Networks • Are there new graph techniques? Do they parallelize? Can the computational systems (algorithms, machines) handle massive networks with millions to billions of individuals? Can the techniques tolerate noisy data, massive data, streaming data, etc. … • Communities may overlap, exhibit different properties and sizes, and be driven by different models • Detect communities (static or emerging) • Identify important individuals • Detect anomalous behavior • Given a community, find a representative member of the community • Given a set of individuals, find the best community that includes them
Characterizing Graph-theoretic computations Factors that influence choice of algorithm Input: Graph abstraction Graph algorithms • graph sparsity (m/n ratio) • static/dynamic nature • weighted/unweighted, weight distribution • vertex degree distribution • directed/undirected • simple/multi/hyper graph • problem size • granularity of computation at nodes/edges • domain-specific characteristics • traversal • shortest path algorithms • flow algorithms • spanning tree algorithms • topological sort • ….. Problem: Find *** • paths • clusters • partitions • matchings • patterns • orderings Graph problems are often recast as sparse linear algebra (e.g., partitioning) or linear programming (e.g., matching) computations
Massive data analytics in Informatics networks • Graphs arising in Informatics are very different from topologies in scientific computing. • We need new data representations and parallel algorithms that exploit topological characteristics of informatics networks. Emerging applications: dynamic, high-dimensional data Static networks, Euclidean topologies
What we’d like to infer from Information networks • What are the degree distributions, clustering coefficients, diameters, etc.? • Heavy-tailed, small-world, expander, geometry+rewiring, local-global decompositions, ... • How do networks grow, evolve, respond to perturbations, etc.? • Preferential attachment, copying, HOT, shrinking diameters, .. • Are there natural clusters, communities, partitions, etc.? • Concept-based clusters, link-based clusters, density-based clusters, ... • How do dynamic processes – search, diffusion, etc. – behave on networks? • Decentralized search, undirected diffusion, cascading epidemics, ... • How best to do learning, e.g., classification, regression, ranking, etc.? • Information retrieval, machine learning, ... Slide credit: Michael Mahoney, Stanford
Graph Libraries Graphs offer a natural representation for unstructured data from a variety of application areas such as biology, social informatics, and security. Queries on these graphs are often challenging due to • the response time needed (cyber security) • ingestion of massive volumes of data (high throughput genome sequencing) • and dynamic updates to the graph (online social networks) Common categories of graph problems • traversal (eg. breadth first search) • optimization (eg. shortest paths) • detection problems (eg. clustering, centrality)
Potential Role of FCP Center Bring together • leaders in the graph algorithms community (from academia, industry, national labs, international labs, and government) • liaisonsfrom tools developers in domain sciences to develop • API for graph algorithms • graph algorithm libraries for accelerators • reference implementations • open source frameworks others can optimize and plug into • standards, benchmarking, and best practices
Conceptualization Goals • Obtain a comprehensive understanding of • the common graph problems in data-intensive grand challenges that best map to future computing platforms • the infrastructure needed to support development of critical scientific software on these platforms • Develop reference implementations, open source frameworks, best practices, etc. that enable a few grand challenge problems • Prioritize appropriate research, development and outreach activities of the FCP Center.