Download
1 / 37
1k likes | 1.98k Vues
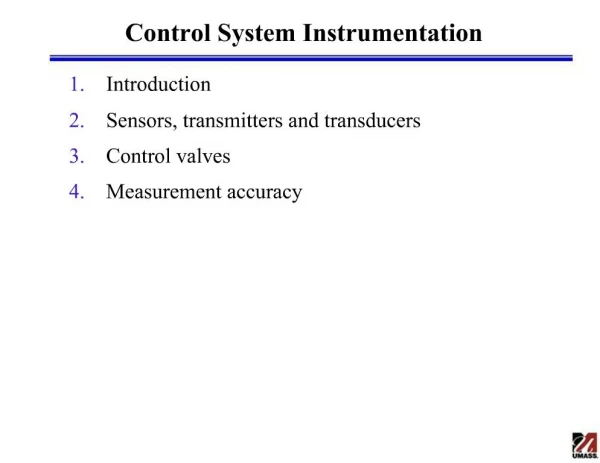
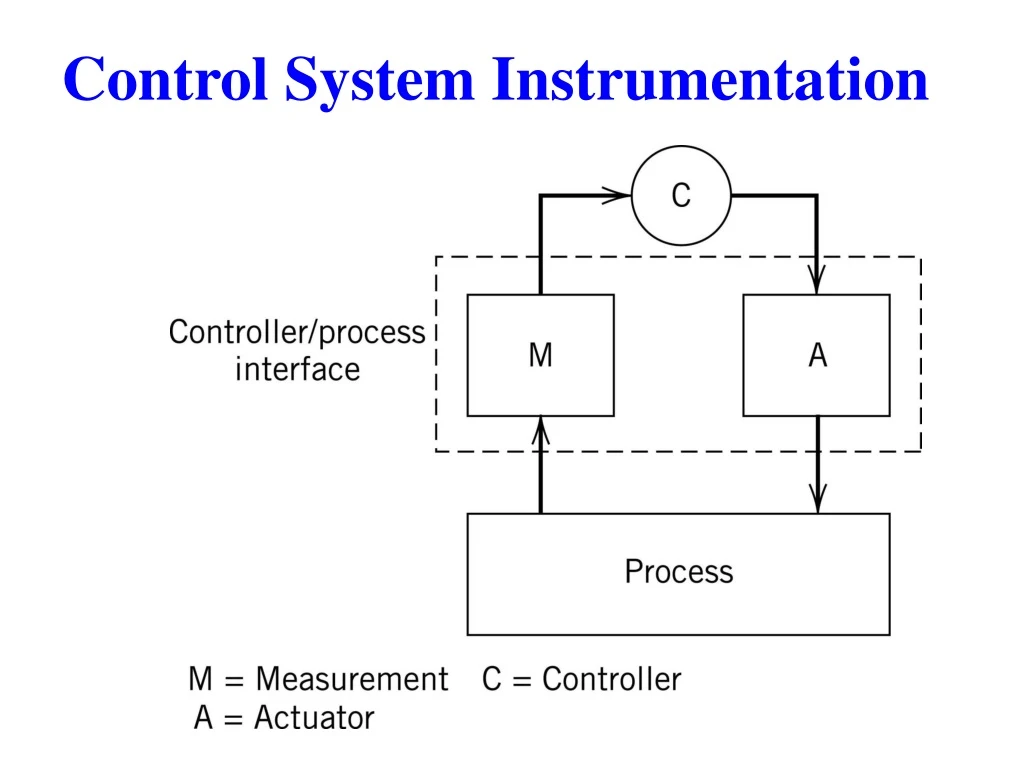
Control System Instrumentation. Standard Instrument Signals. Pneumatic (air pressure): 3 – 15 psig Electrical: 4 – 20 mA I/P or E/P transducer. Transducers and Transmitters. Chapter 9.

E N D
Standard Instrument Signals • Pneumatic (air pressure): 3 – 15 psig • Electrical: 4 – 20 mA • I/P or E/P transducer
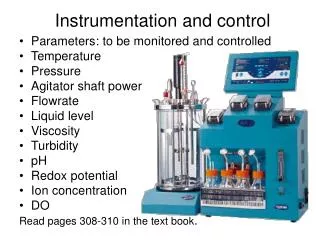
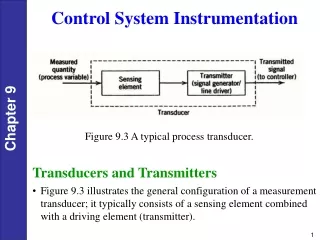
Transducers and Transmitters Chapter 9 • Figure 9.3 illustrates the general configuration of a measurement transducer; it typically consists of a sensing element combined with a driving element (transmitter). • Since about 1960, electronic instrumentation has come into widespread use.
Sensors The book briefly discusses commonly used sensors for the most important process variables. (See text.) Transmitters • A transmitter usually converts the sensor output to a signal level appropriate for input to a controller, such as 4 to 20 mA. • Transmitters are generally designed to be direct acting. • In addition, most commercial transmitters have an adjustable input range (or span). • For example, a temperature transmitter might be adjusted so that the input range of a platinum resistance element (the sensor) is 50 to 150 °C. Chapter 9
Measurement / Transmission Lags • Temperature sensor • make as small as possible (location, materials for thermowell) • Pneumatic transmission lines • usually pure time delay, measure experimentally (no time delays for electronic lines); less common today compared to electronic transmissions. Chapter 9
Transmitter/Controller Chapter 9 May need additional transducers for Gm if its output is in mA or psi. In the above case, Gc is dimensionless (volts/volts).
Measurement Errors • Systematic errors • Drift: slowly changing instrument output when input is constant. • Nonlinearity • Hysteresis or backlash • Dead band • Dynamic error • Random errors
Chapter 9 Figure 9.15 Nonideal instrument behavior: (a) hysteresis, (b) dead band.
Precision, Resolution, Accuracy and Repeatability • Precision can be interpreted as the number of significant digits in measurement, but more accurately it refers to the least significant digit which contains valid information, e.g., 0.01 in the present case. Therefore, 0.33 is more precise than 0.3. • Resolution is defined as the smallest change in the input that will result in a significant change in the transducer output. • Repeatability is +/- 0.02 in the present case. • Accuracy is 0.39-0.25=0.14, i.e., maximum error.
Final Control Elements • The most-common manipulated variables to be adjusted are: (1) energy flow rates, and (2) material flow rates. • Type (1): transducer + heating element • Type (2): transducer + control valve (pump drive, screw conveyer, blower, etc.)
Pressure Drop Across Control Valve Installed On-Line In practical applications, one must take other flow obstructions into account for actual valve performance.
Installed Valve Characteristics • Desired behavior: the flow rate is a linear function of valve lift. • Let us assume that the control valve has linear trim and it is necessary to increase the flow rate. If p through exchanger did not change, then valve would behave linearly (true for low flow rates), since it takes most of p . For higher flow rates, p through exchanger will be important, changing effective valve characteristics (valve must open more than expected nonlinear behavior).