Download
1 / 44
440 likes | 471 Vues
Explore the capacity of visual memory in perceiving rich details & how visual inquiries inform problem-solving in design with cyborgs in mind. Dive into the cognitive processes behind effective information display & the science of visualization evaluation through patterns and attentional demands.

E N D
Visual Queries:The foundation of visual thinking Colin Ware Data Visualization Research Lab University of New Hampshire Designing with cyborgs in mind
Change Blindness Simons and Levin
Vogel Woodman and Luck • Capacity of visual working memory 3 simple shapes
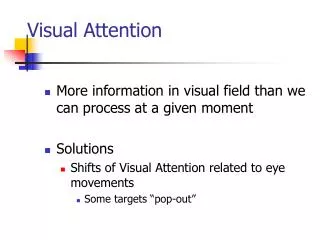
Central Problem: How do we perceivethe world in all its rich detail? • Only detail in fovea • Only a small amount of Information in visual working memory.
Solution • “The world is its own memory” O’Regan • Task-related active vision • “What you see is what you need” • Treish et al. (2003) • Seeing is a process that helps us solve problems
Visualizations are much better databases than what we have in our heads
Stage 2 Pattern perceptionVisual queries are executed by finding patterns in displays Attentional Demands Tune the pattern finding processes Top down meets bottom up
Eye movements • Two or three a second • Preserves Context • We seek patterns
ME Graph Constellation
Why visualize? • Human Memory: 100 meg (Landauer) = 108(not unique) • World information: 1 exabyte/year • = 1018 (unique) • = 108 bytes new information per person per year • Conclusion: we are cognitive cyborgs – our memories are not in our heads.
Why do we care about perception? • It is about what makes information display effective. • Can there be a science of visualization? • Evaluation
Visualizations • Maps • Route • Flow • Thematic (geology, vegetation, etc) • Multi-dimensional Discrete • Multi-dimensional continuous • Graphs • Social Networks • Flow • Narrative – explaining data • Animations, assembly diagrams • Other thinking tools • Calendars, Planners, search engines, News pages, Design tools
Understanding surface shape Victoria Interrante
GeoZui4D Linked Windows Tide Aware Show GeoNav
Flow visualization • How do we optimally display vector fields?
Length - 420 ft 16,000 Tons • Beam – 82 ft 30,000 HP • Draft – 29 ft Diesel Elec AC/AC • Fuel – 1,165,000 gal Top Speed – 17kts • Ice Breaking – 4.5 ft @ 3 kts
CAVE • Head tracking – stereo • Resolution problems • Light scattering problems • Vergence focus problem for near object • Occlusion problems for near objects
Immersion VR • HMD + head tracking • Data glove
Capacity of visual working memory (Vogal, Woodman, Luck, 2001) • Task – change detection • Can see 3.3 objects • Each object can be complex 1 second
Dual Processing OBJECT FILES “Nexus” Dog