Download
1 / 9
90 likes | 216 Vues
This chapter provides an overview of quantitative and qualitative data. It emphasizes how quantitative data can be measured using numbers and figures, while qualitative data gathers information about concepts and ideas. Key topics include the definition of population and variable, the concept of frequency, and various graphing options such as histograms and stem-leaf plots. Examples illustrate how to analyze student grades and age data using frequency distribution, highlighting essential statistical measures like mean, median, and mode to enhance data analysis skills.

E N D
Math 1332 Chapter 12.1 Data and Analysis
Quantitative data – can be measured with numbers and figures Qualitative data – is used to gather information about issues or ideas Carefully read the questions in section 12.1 to be sure you are answering what is asked. Population – who is being surveyed Variable – What is changing Frequency – how often something occurs
Graphing options Frequency Distribution Grouped Frequency Distribution
Graphing options 8 6 4 2 Histogram # of blond student 9 10 11 12 13 Student Age • 4 4 5 6 8 • 1 4 5 5 • 1 6 7 9 • 7 1 4 7 Stem-Leaf Plot Break # into two parts Data: 44,46,44,45,48,51 54,55,55,61,66,67,69,71,77,74 “stem” “leaves”
Test Grades: 70,74,85,70,90,85,92,88,75,85,93,92,85,71,76,82,95,82,75,99 Grouped Frequency Distribution Histogram 8 6 4 2 # of Grades 90-100 80-89 70-79 Grade Range 9 0 2 2 3 5 9 8 2 2 5 5 5 5 8 7 0 0 1 4 5 5 6 Stem-Leaf Plot
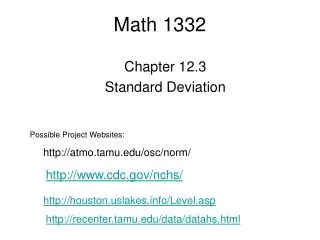
Math 1332 Chapter 12.2 Mean, Median, Mode, Midrange
Project • 25% of your next test grade • Due on May 3 (or before) • Must be typed